Health Report Analysis
from IPython.display import HTML, display, display_html
import os
import pandas as pd
import numpy as np
import plotly.io as pio
pio.renderers.default = "sphinx_gallery"
from IPython.display import display, HTML
from vitalDSP.health_analysis.health_report_generator import HealthReportGenerator
np.random.seed(42)
duration = 60
fs = 100
# Generate mock feature data
feature_data = {
        "sdnn": np.random.normal(
            50, 10, duration
        ).tolist(),  # Normally distributed around 50 with std dev of 10
        "rmssd": np.random.normal(
            30, 8, duration
        ).tolist(),  # Normally distributed around 30 with std dev of 8
        "total_power": np.random.normal(
            1600, 300, duration
        ).tolist(),  # Normally distributed around 1600 with std dev of 300
        "lfnu_power": np.random.normal(
            45, 5, duration
        ).tolist(),  # Normally distributed around 45 with std dev of 5
        "hfnu_power": np.random.normal(
            35, 4, duration
        ).tolist(),  # Normally distributed around 35 with std dev of 4
        "fractal_dimension": np.random.normal(
            1.25, 0.05, duration
        ).tolist(),  # Normally around 1.25 with std dev of 0.05
        "dfa": np.random.normal(
            1.2, 0.08, duration
        ).tolist(),  # Normally distributed around 1.2 with std dev of 0.08
        "poincare_sd1": np.random.normal(
            28.5, 3, duration
        ).tolist(),  # Normally around 28.5 with std dev of 3
        "poincare_sd2": np.random.normal(
            45, 4, duration
        ).tolist(),  # Normally around 45 with std dev of 4
        "sample_entropy": np.random.normal(
            0.85, 0.1, duration
        ).tolist(),  # Normally around 0.85 with std dev of 0.1
        "approximate_entropy": np.random.normal(
            0.72, 0.1, duration
        ).tolist(),  # Normally around 0.72 with std dev of 0.1
        "recurrence_rate": np.random.normal(
            0.65, 0.1, duration
        ).tolist(),  # Normally around 0.65 with std dev of 0.1
        "determinism": np.random.normal(
            0.78, 0.1, duration
        ).tolist(),  # Normally around 0.78 with std dev of 0.1
        "laminarity": np.random.normal(
            0.85, 0.05, duration
        ).tolist(),  # Normally around 0.85 with std dev of 0.05
        "systolic_duration": np.random.normal(
            0.35, 0.05, duration
        ).tolist(),  # Normally around 0.35 with std dev of 0.05
        "diastolic_duration": np.random.normal(
            0.5, 0.05, duration
        ).tolist(),  # Normally around 0.5 with std dev of 0.05
        "systolic_area": np.random.normal(
            200, 20, duration
        ).tolist(),  # Normally around 200 with std dev of 20
        "diastolic_area": np.random.normal(
            180, 20, duration
        ).tolist(),  # Normally around 180 with std dev of 20
        "systolic_slope": np.random.normal(
            1.5, 0.1, duration
        ).tolist(),  # Normally around 1.5 with std dev of 0.1
        "diastolic_slope": np.random.normal(
            1.2, 0.1, duration
        ).tolist(),  # Normally around 1.2 with std dev of 0.1
        "signal_skewness": np.random.normal(
            0.1, 0.02, duration
        ).tolist(),  # Normally around 0.1 with std dev of 0.02
        "peak_trend_slope": np.random.normal(
            0.05, 0.01, duration
        ).tolist(),  # Normally around 0.05 with std dev of 0.01
        "systolic_amplitude_variability": np.random.normal(
            5.0, 0.5, duration
        ).tolist(),  # Normally around 5.0 with std dev of 0.5
        "diastolic_amplitude_variability": np.random.normal(
            4.8, 0.5, duration
        ).tolist(),  # Normally around 4.8 with std dev of 0.5
        # "respiratory_rate": np.random.normal(16, 3, duration).tolist(),  # Normally around 16 breaths/min with std dev of 3
        # "pulse_pressure": np.random.normal(40, 5, duration).tolist(),  # Normally around 40 mmHg with std dev of 5
        # "stroke_volume": np.random.normal(70, 10, duration).tolist(),  # Normally around 70 mL with std dev of 10
        # "cardiac_output": np.random.normal(5.5, 0.7, duration).tolist(),  # Normally around 5.5 L/min with std dev of 0.7
        # "qt_interval": np.random.normal(400, 20, duration).tolist(),  # Normally around 400 ms with std dev of 20
        # "qrs_duration": np.random.normal(90, 10, duration).tolist(),  # Normally around 90 ms with std dev of 10
        # "p_wave_duration": np.random.normal(100, 10, duration).tolist(),  # Normally around 100 ms with std dev of 10
        # "pr_interval": np.random.normal(160, 20, duration).tolist(),  # Normally around 160 ms with std dev of 20
}

# Initialize the health report generator
report_generator = HealthReportGenerator(
        feature_data=feature_data, segment_duration="1_min"
)

image_dir = "../_static/images"
os.makedirs(image_dir, exist_ok=True)

# Generate the report (HTML)
report_html = report_generator.generate(output_dir=image_dir)
Processing 24 features concurrently...
Feature processing completed in 0.01 seconds
Generating visualizations concurrently using processes (matplotlib process-safe)... This may take a moment.
Generating visualizations for 24 features using 2 processes (matplotlib process-safe)...
Processing sdnn...
Processing rmssd...
Completed sdnn
Processing total_power...
Completed rmssd
Processing lfnu_power...
Completed lfnu_power
Processing hfnu_power...
Completed total_power
Processing fractal_dimension...
Completed hfnu_power
Processing dfa...
Completed fractal_dimension
Processing poincare_sd1...
Completed dfa
Processing poincare_sd2...
Completed poincare_sd1
Processing sample_entropy...
Completed poincare_sd2
Processing approximate_entropy...
Completed sample_entropy
Processing recurrence_rate...
Completed approximate_entropy
Processing determinism...
Completed recurrence_rate
Processing laminarity...
Completed determinism
Processing systolic_duration...
Completed laminarity
Processing diastolic_duration...
Completed diastolic_duration
Processing systolic_area...
Completed systolic_duration
Processing diastolic_area...
Completed systolic_area
Processing systolic_slope...
Completed diastolic_area
Processing diastolic_slope...
Completed systolic_slope
Processing signal_skewness...
Completed diastolic_slope
Processing peak_trend_slope...
Completed signal_skewness
Processing systolic_amplitude_variability...
Completed peak_trend_slope
Processing diastolic_amplitude_variability...
Completed systolic_amplitude_variability
Completed diastolic_amplitude_variability
Completed visualization generation for 24 features
Generated visualizations for 24 features in 45.58 seconds

Report generation completed!
Total time: 45.63 seconds
Features processed: 24
Visualizations generated: 24
Feature processing: Concurrent (2 workers)
Visualization generation: Concurrent (2 processes)
Display the health analysis report
display(HTML(report_html))
Health Analysis Report
Executive Summary
Your physiological parameters indicate areas of concern with only 37.5% of features within normal ranges. Areas of concern include: 8 parameter(s) above normal range, 7 parameter(s) below normal range.
Risk Assessment
Key Insights
- Multiple parameters (15) require attention
- Heart rate variability parameters indicate healthy autonomic function
Analysis Summary
Key Correlations
SDNN (48.5 ms) and RMSSD (30.0 ms) show strong positive correlation, both indica...
Recommendations
- Schedule immediate consultation with a healthcare professional
- Regular monitoring and follow-up assessments are recommended
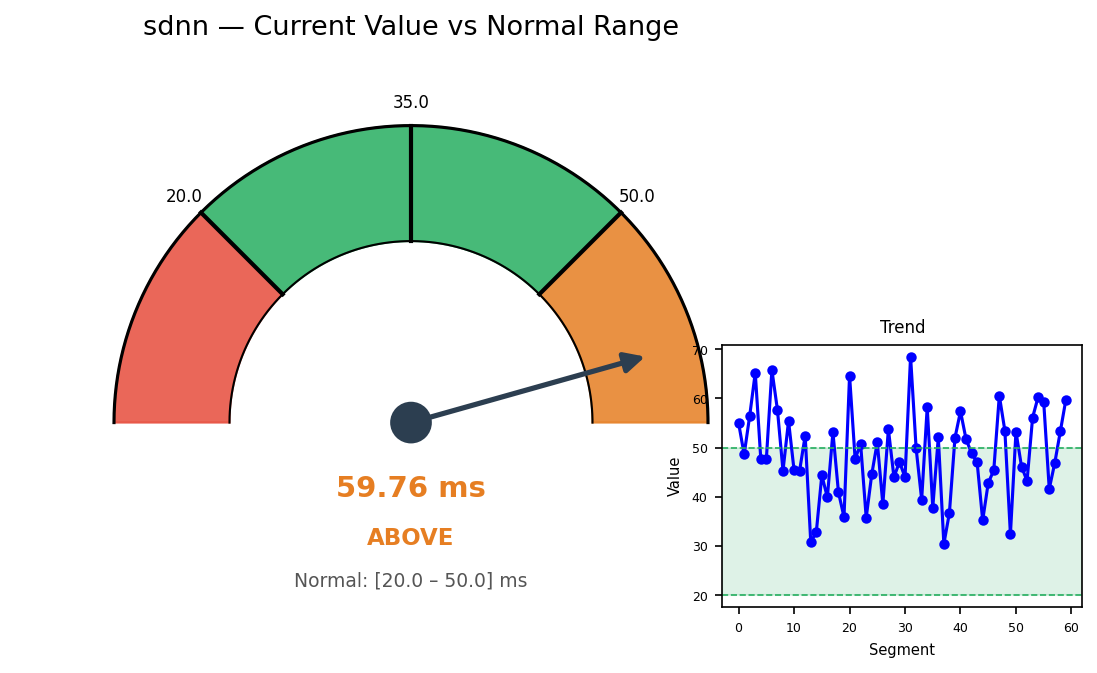
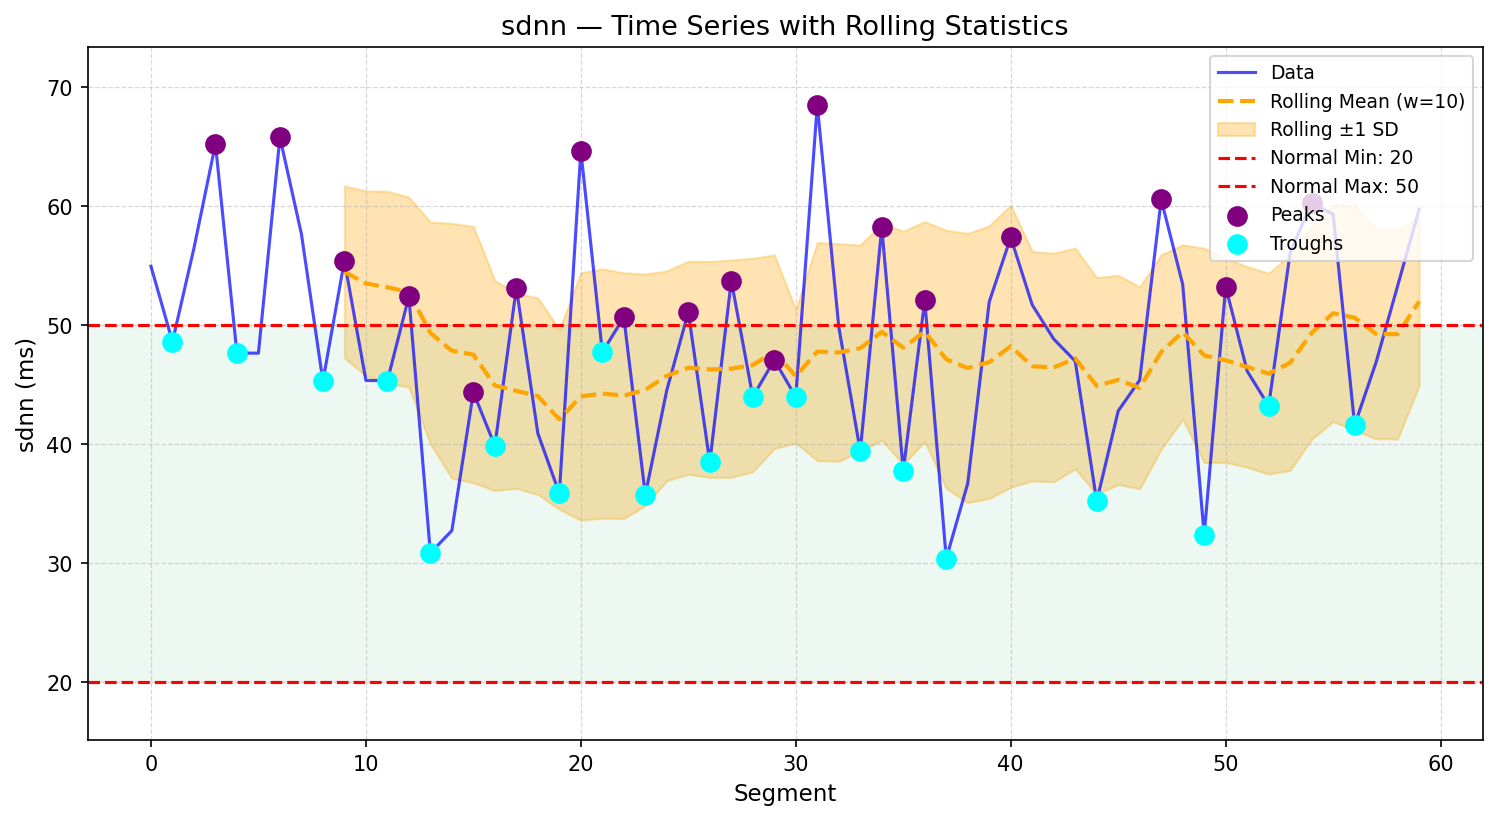
sdnn
Description:
SDNN measures the overall variability in heart rate by calculating the standard deviation of all NN intervals. It reflects both short-term and long-term components of heart rate variability (HRV). Reduced SDNN is associated with increased risk of cardiovascular diseases and mortality. Your current value of 48.5 is within the normal range of 20-50.
Interpretation:
Normal SDNN indicates balanced autonomic regulation, with healthy heart rate variability reflecting both sympathetic and parasympathetic activity. Your SDNN of 48.5 ms is within normal limits, indicating adequate heart rate variability. While not optimal, this suggests functional autonomic regulation.
Values
Median
47.700
Standard Deviation
9.009
Range
20
50
Contradiction:
Low SDNN contradicts high RMSSD, as both reflect similar aspects of heart rate variability.
Correlation Analysis:
Correlated with RMSSD, as both represent short-term variability. Your SDNN of 48.5 ms is within normal limits, which typically correlates moderately with other HRV parameters. This suggests that other variability measures should also be within normal ranges.
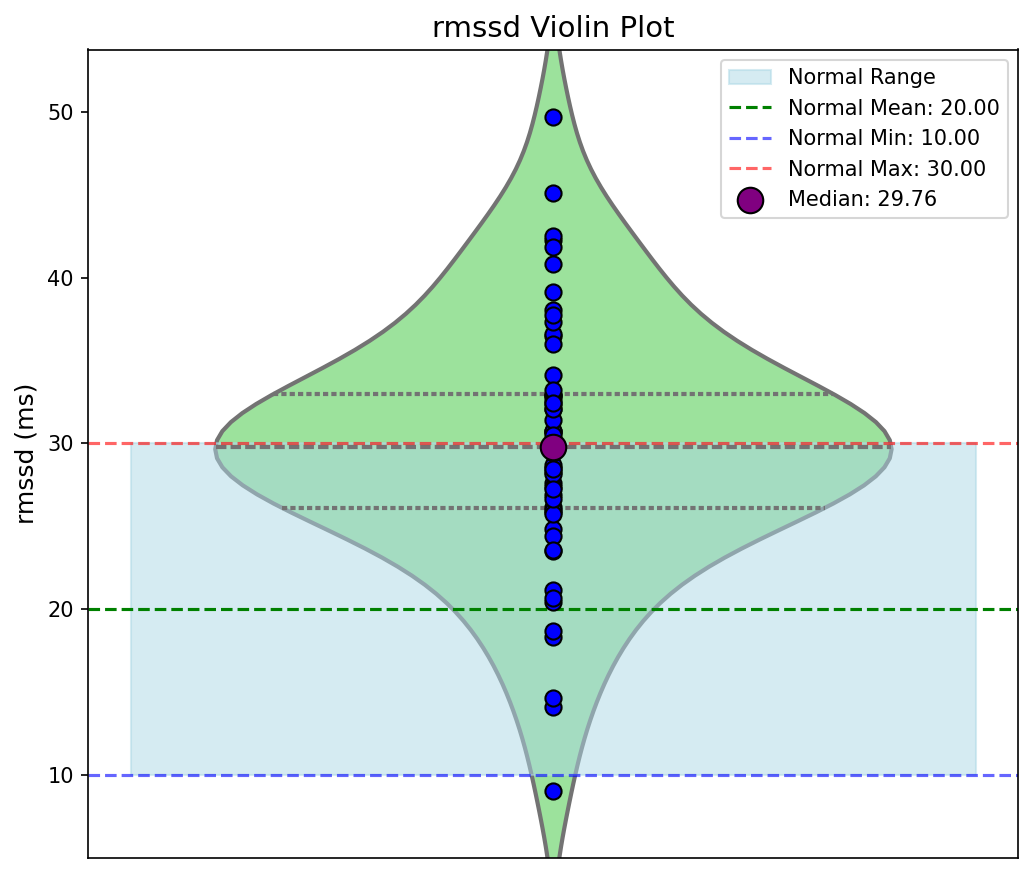
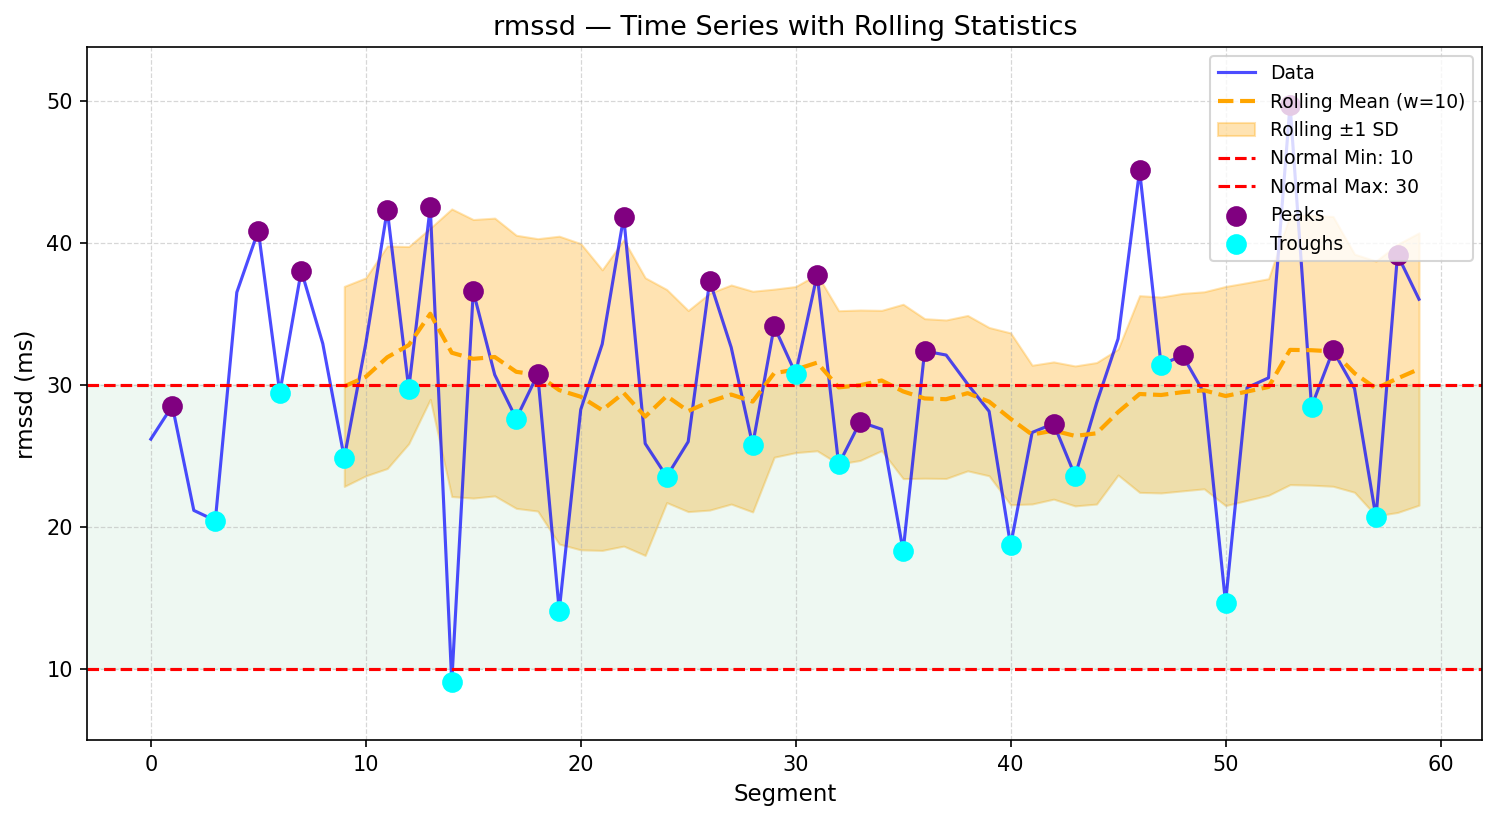
rmssd
Description:
RMSSD reflects short-term heart rate variability by measuring the root mean square of differences between successive NN intervals. It is primarily influenced by parasympathetic (vagal) activity. Higher values indicate healthy parasympathetic function, while lower values suggest autonomic imbalance. Your current value of 30.0 is within the normal range of 10-30.
Interpretation:
Normal RMSSD indicates strong parasympathetic regulation and healthy short-term heart rate variability. Your RMSSD of 30.0 ms is within normal limits, indicating adequate parasympathetic function. While not optimal, this suggests functional autonomic regulation.
Values
Median
29.755
Standard Deviation
7.484
Range
10
30
Contradiction:
Low RMSSD contradicts high SDNN, as both should reflect similar aspects of variability.
Correlation Analysis:
Correlated with SDNN, as both reflect heart rate variability. Your RMSSD of 30.0 ms is within normal limits, which typically correlates moderately with other short-term HRV parameters. This suggests that other parasympathetic indicators should also be within normal ranges.
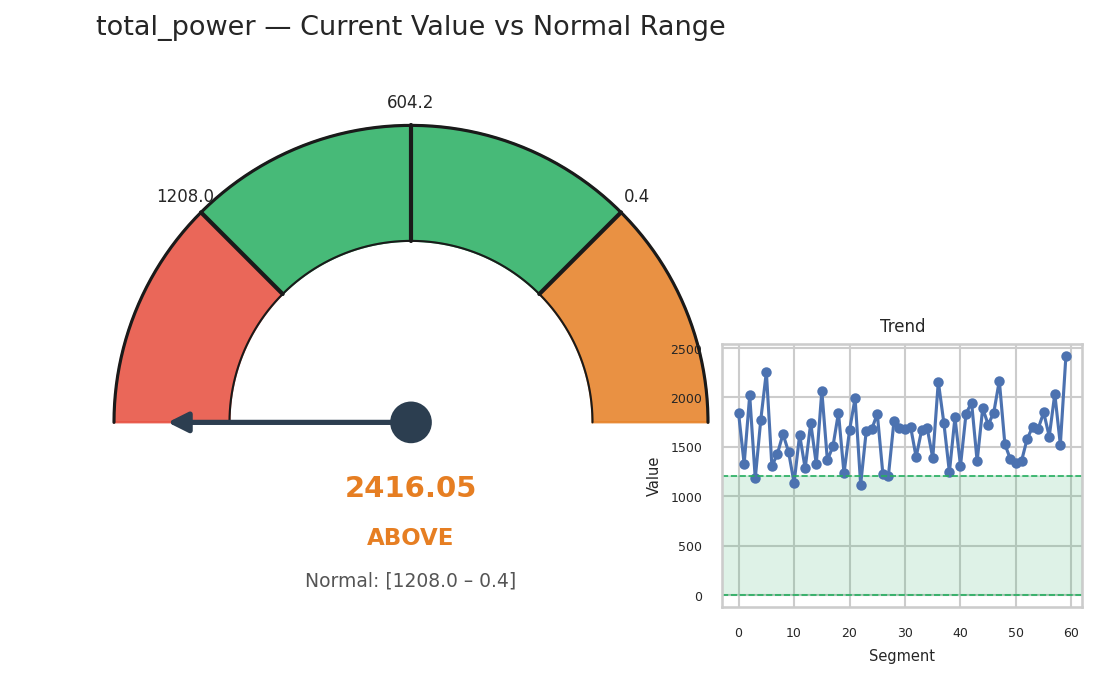
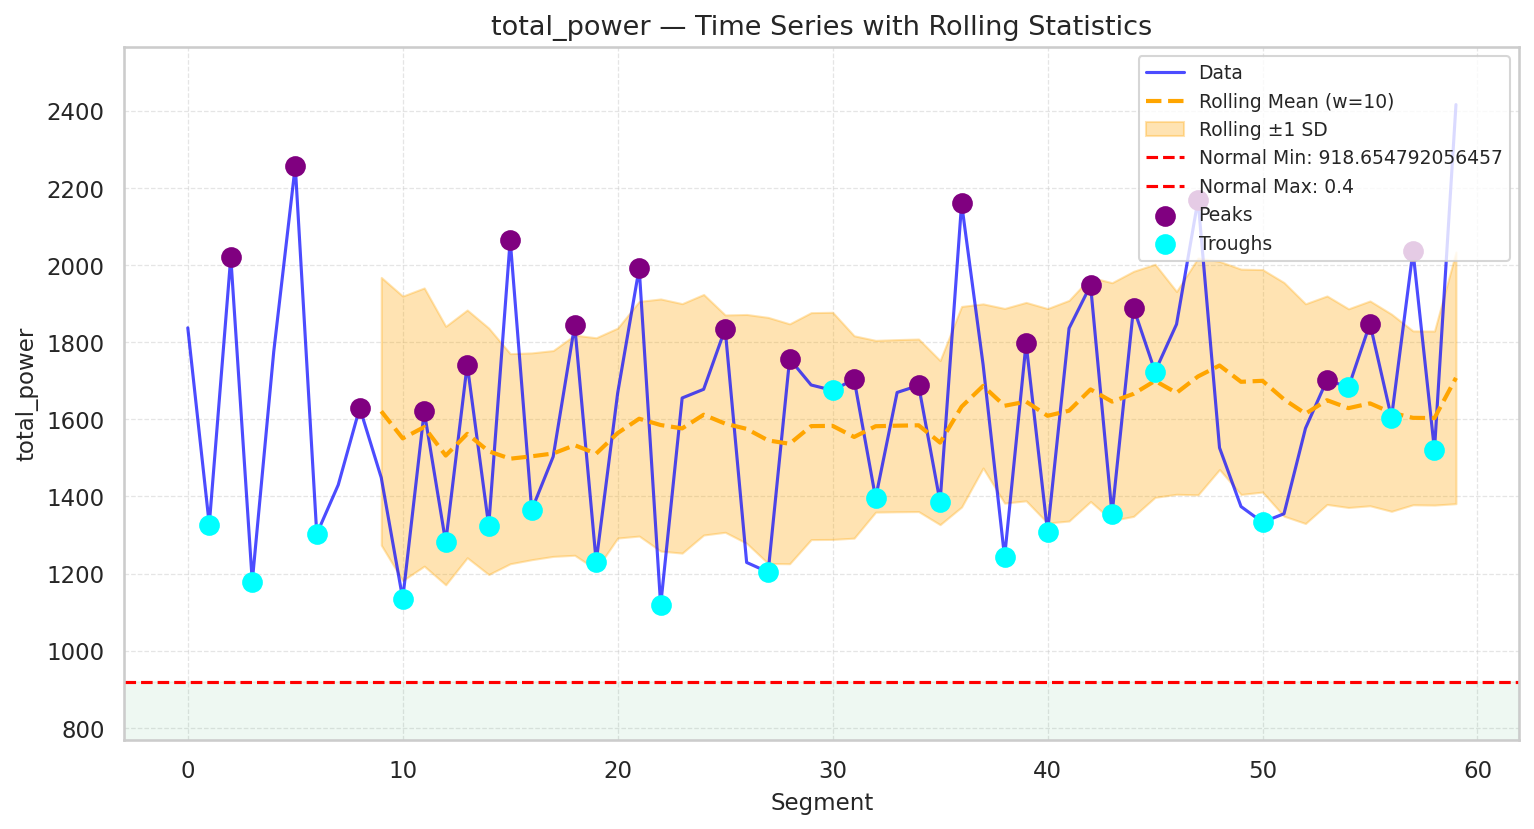
total_power
Description:
Total power represents the overall heart rate variability across all frequency bands (ULF, VLF, LF, HF). It provides an overview of autonomic function and overall variability in heart rate. Your current value of 1627.6 is above the normal range of -inf-0.4.
Interpretation:
High total power suggests excessive heart rate variability, possibly indicating arrhythmias or unstable autonomic regulation. Your total_power value of 1627.6 is above the normal range.
Values
Median
1668.957
Standard Deviation
296.330
Range
-inf
0.4
Contradiction:
Low total power contradicts high LF power, as LF is a major component of total power.
Correlation Analysis:
Correlated with LF power and overall HRV.
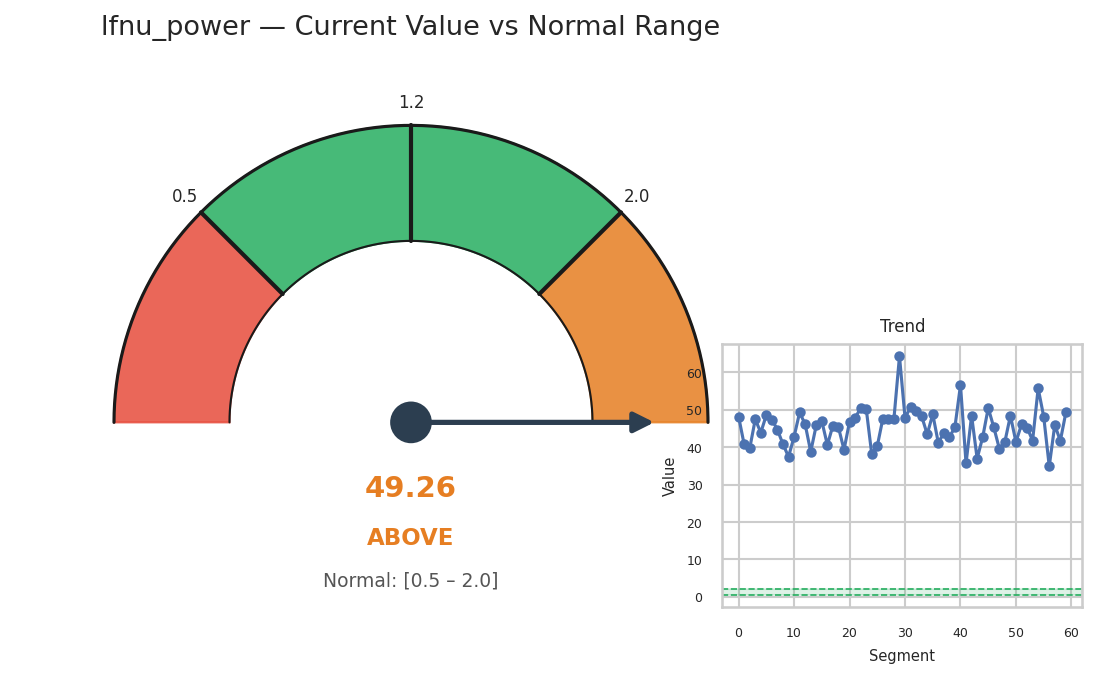
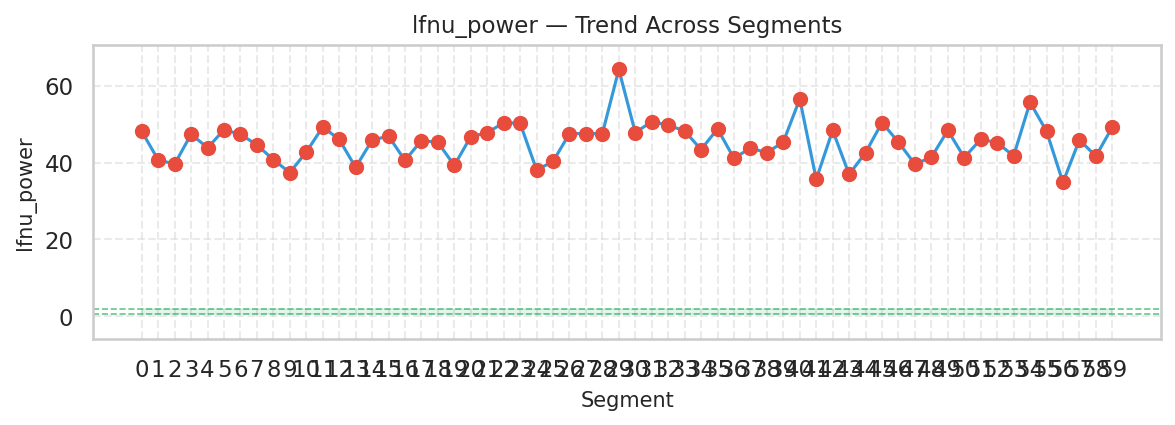
lfnu_power
Description:
LFnu power represents the normalized value of low-frequency components as a proportion of total power (excluding VLF). It reflects the relative contribution of sympathetic activity to heart rate variability. Your current value of 45.3 is significantly above the normal range of 0.5-2.0, which may require attention.
Interpretation:
High LFnu power indicates sympathetic dominance, commonly associated with stress, cardiovascular strain, or hypertension. Your lfnu_power value of 45.3 is above the normal range.
Values
Median
45.817
Standard Deviation
5.138
Range
0.5
2.0
Contradiction:
High LFnu contradicts high HFnu, as both represent opposite branches of the autonomic nervous system.
Correlation Analysis:
Correlated with LF/HF ratio and overall sympathetic dominance.
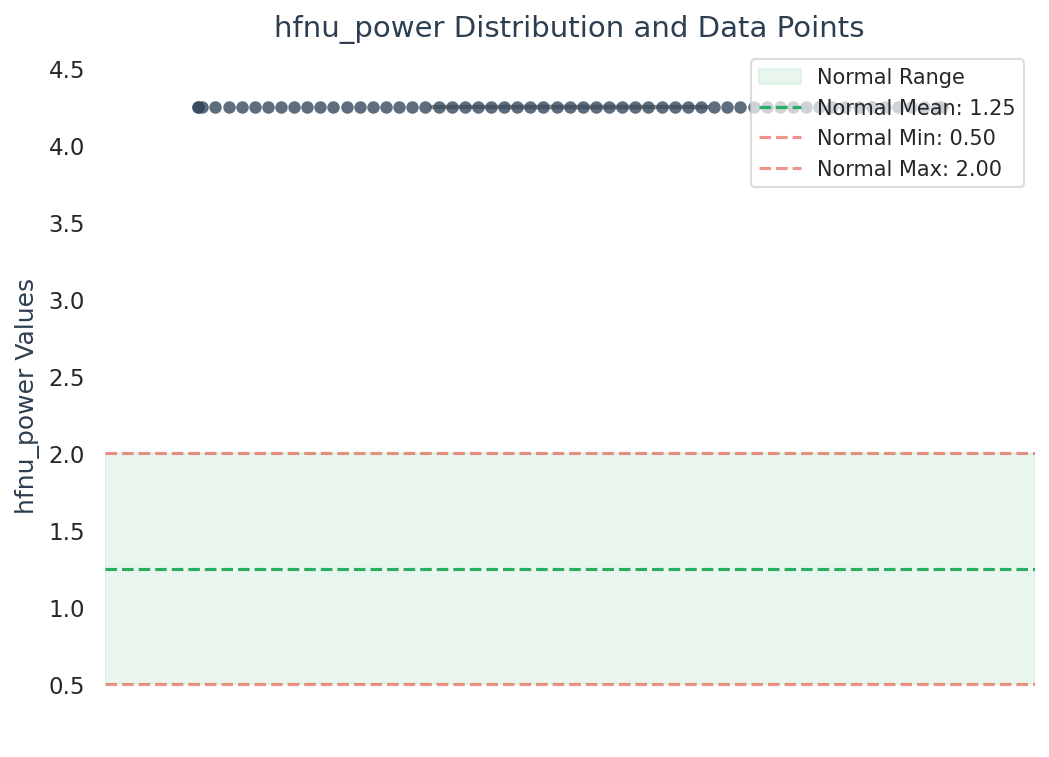
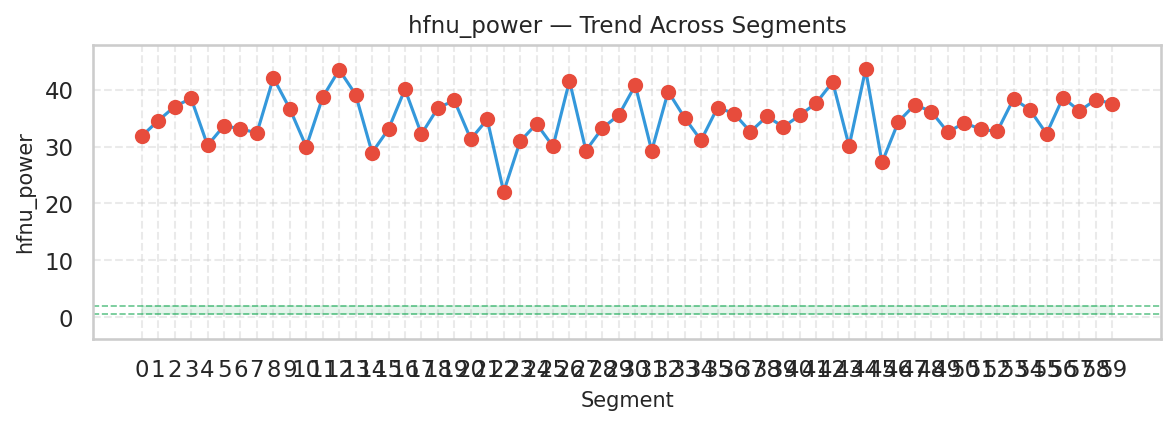
hfnu_power
Description:
HFnu power represents the normalized value of high-frequency components as a proportion of total power (excluding VLF). It reflects the relative contribution of parasympathetic activity to heart rate variability. Your current value of 34.9 is significantly above the normal range of 0.5-2.0, which may require attention.
Interpretation:
High HFnu power suggests enhanced parasympathetic activity, commonly seen during relaxation or recovery. Your hfnu_power value of 34.9 is above the normal range.
Values
Median
34.901
Standard Deviation
4.143
Range
0.5
2.0
Contradiction:
High HFnu contradicts high LFnu, as both represent opposite branches of the autonomic nervous system.
Correlation Analysis:
Correlated with RMSSD and pNN50, reflecting parasympathetic dominance.
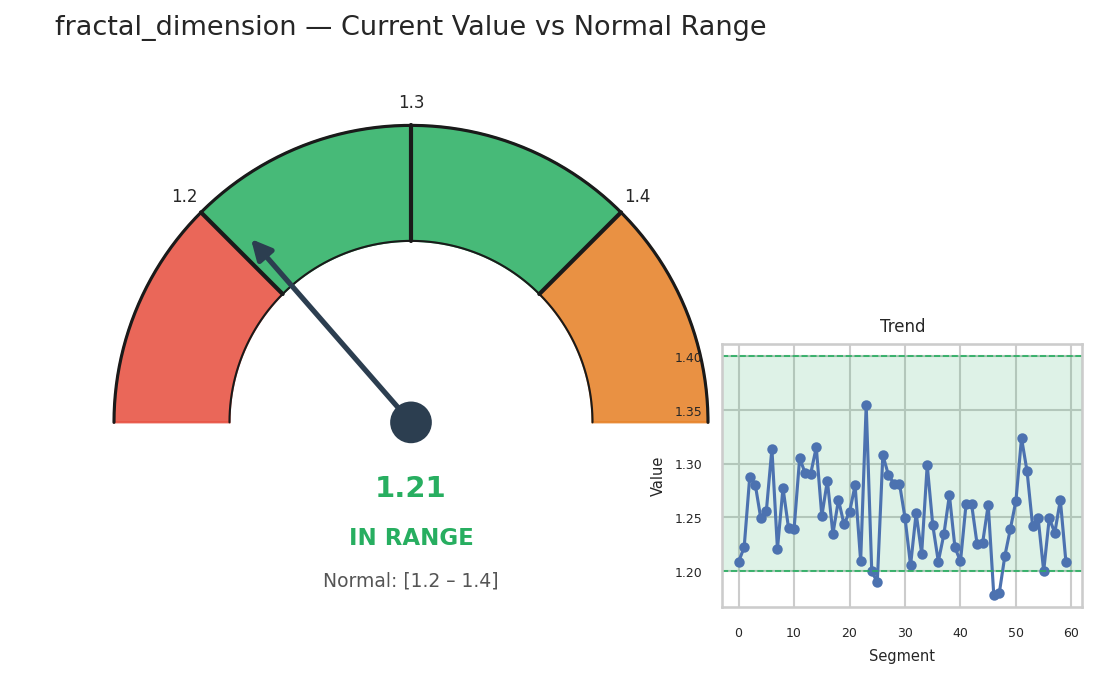
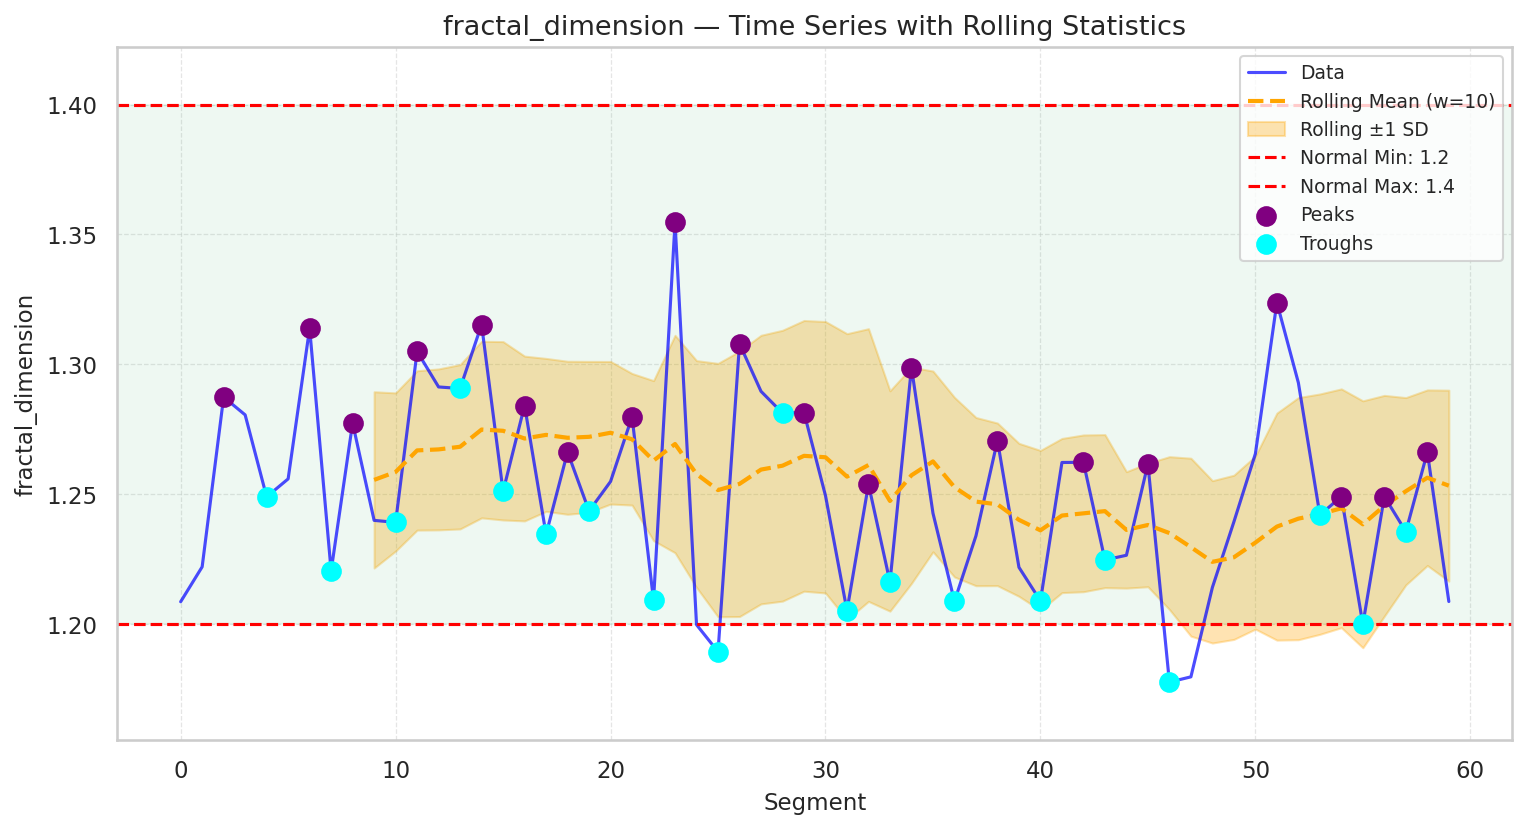
fractal_dimension
Description:
Fractal dimension is a measure of the complexity of the physiological signal. Lower fractal dimensions indicate reduced complexity, often due to cardiovascular dysfunction, while higher values suggest more complex patterns. Your current value of 1.3 is in the good range of 1.2-1.4, indicating healthy function.
Interpretation:
Normal fractal dimension suggests healthy signal complexity, reflecting stable cardiovascular function and autonomic balance. Your fractal_dimension value of 1.3 is normal the normal range.
Values
Median
1.249
Standard Deviation
0.038
Range
1.2
1.4
Contradiction:
Low fractal dimension contradicts high HRV, as both reflect the complexity of the physiological signals.
Correlation Analysis:
Correlated with overall HRV and parasympathetic regulation.
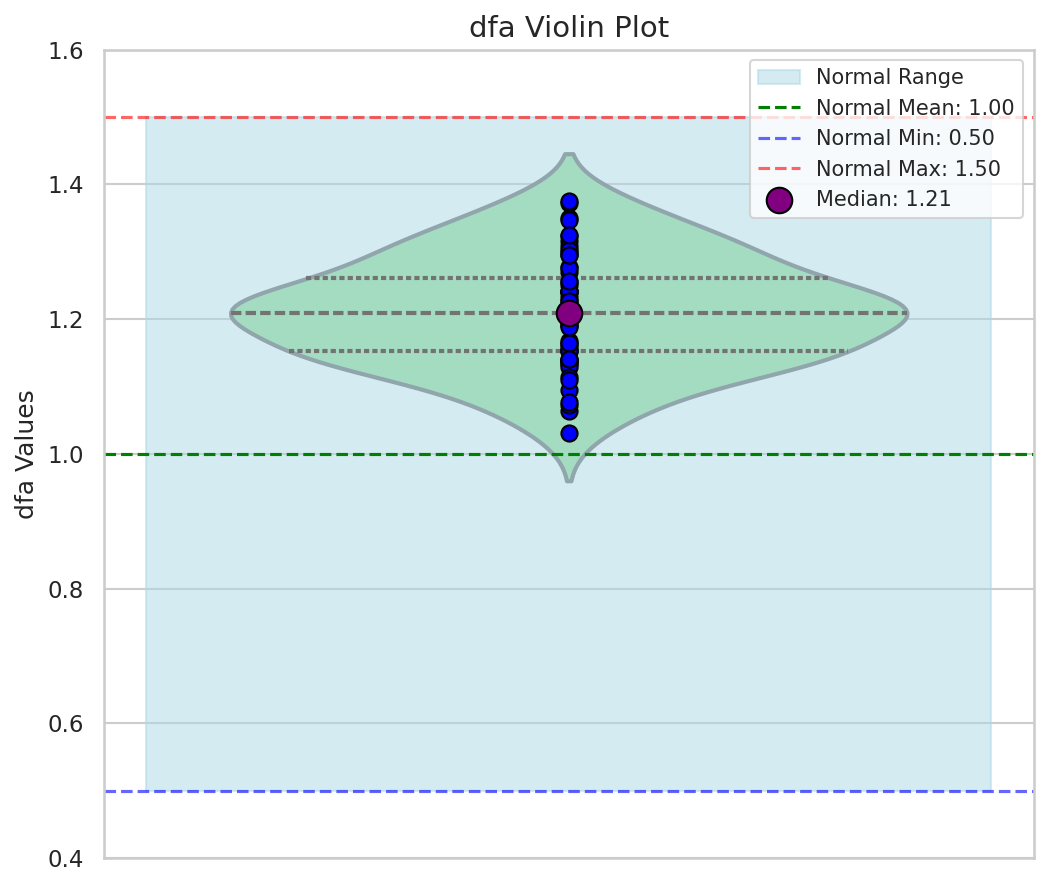
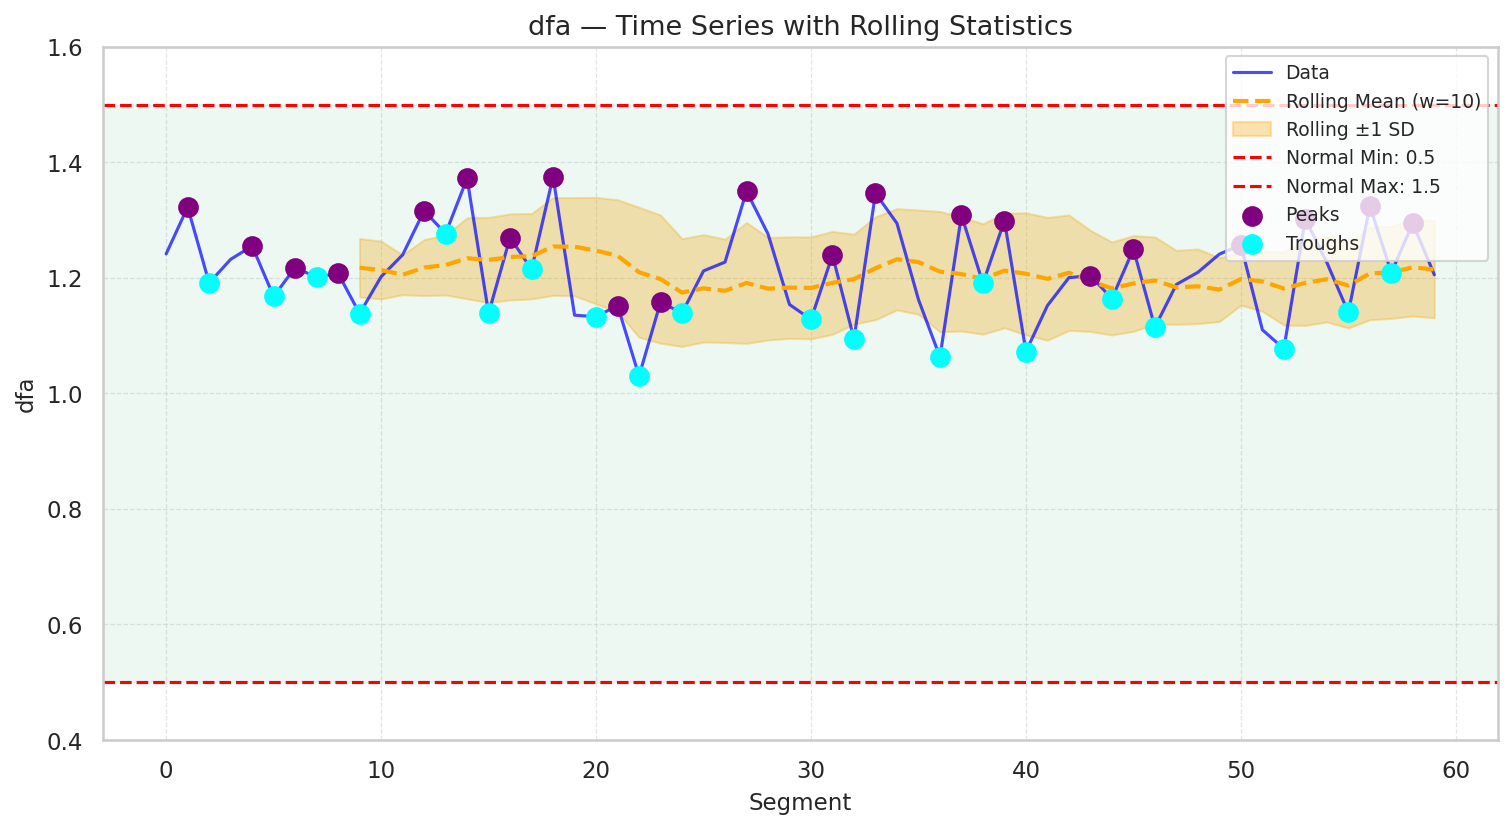
dfa
Description:
DFA reflects the self-similarity and fractal scaling of heart rate variability, providing insight into the long-term correlations in the signal. It is used to assess autonomic regulation and cardiovascular health. Your current value of 1.2 is in the good range of 0.5-1.5, indicating healthy function.
Interpretation:
Normal DFA suggests healthy autonomic regulation and appropriate fractal scaling of the physiological signal. Your dfa value of 1.2 is normal the normal range.
Values
Median
1.209
Standard Deviation
0.079
Range
0.5
1.5
Contradiction:
Low DFA contradicts high fractal dimension, as both should reflect similar physiological signal complexity.
Correlation Analysis:
Correlated with overall HRV and parasympathetic regulation.
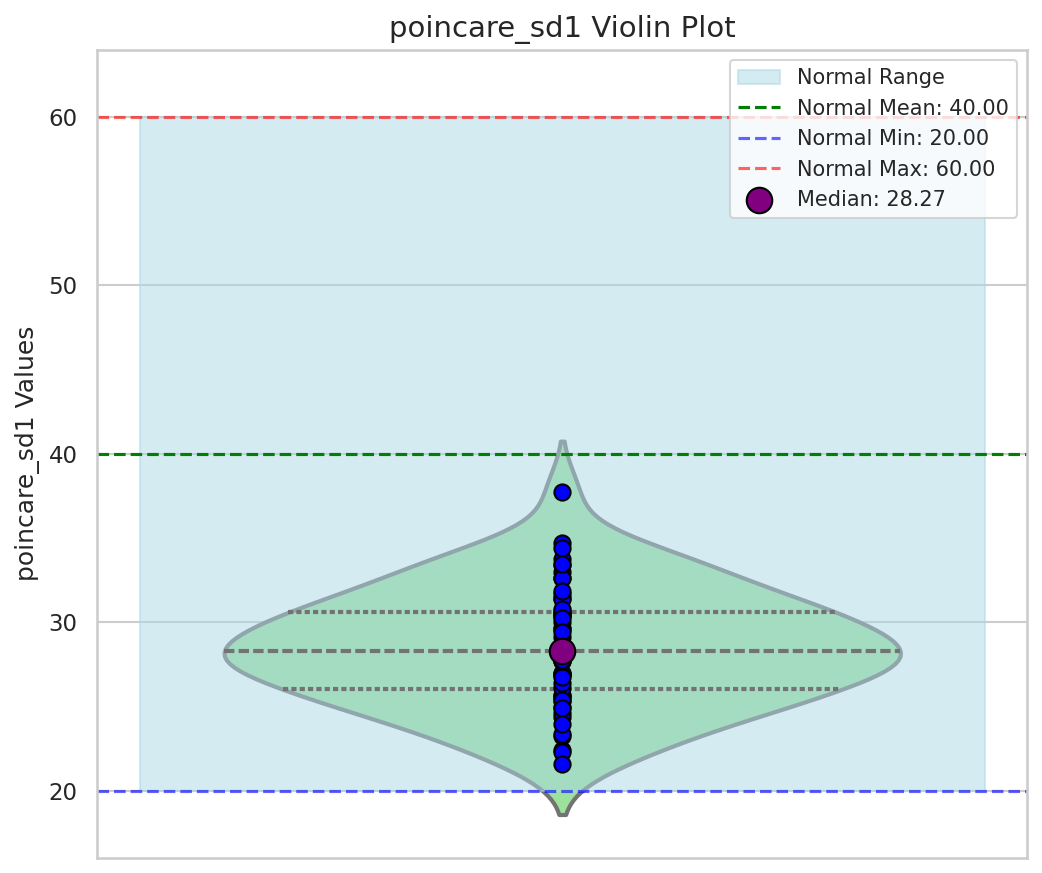
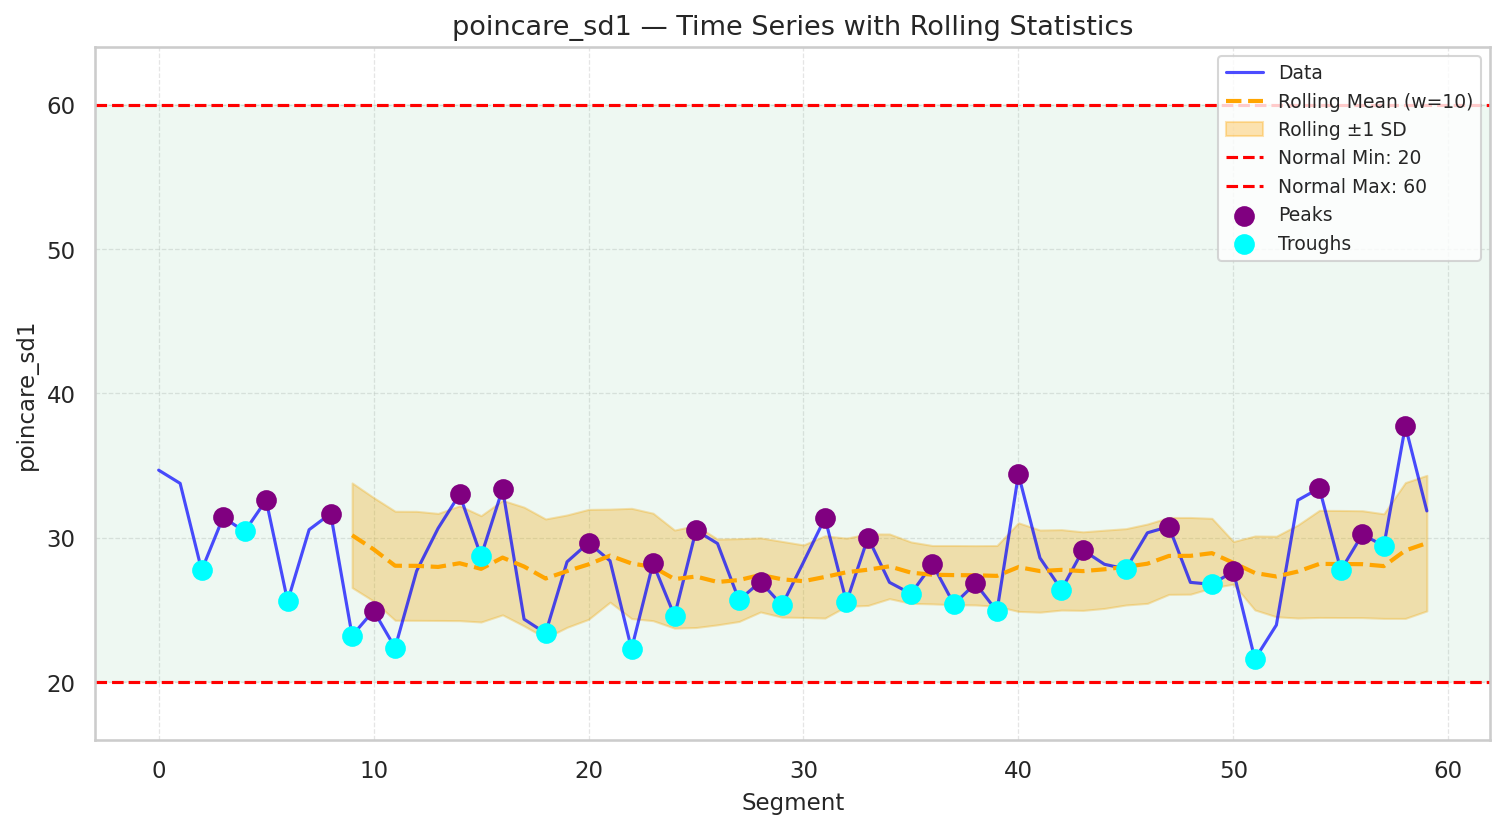
poincare_sd1
Description:
SD1 represents the short-term variability in heart rate, typically associated with parasympathetic activity. It is derived from the Poincaré plot of successive NN intervals and reflects the width of the plot. Your current value of 28.5 is within the normal range of 20-60.
Interpretation:
Normal SD1 indicates healthy short-term variability and strong parasympathetic regulation. Your poincare_sd1 value of 28.5 is normal the normal range.
Values
Median
28.272
Standard Deviation
3.387
Range
20
60
Contradiction:
Low SD1 contradicts high RMSSD, as both should reflect similar parasympathetic activity.
Correlation Analysis:
Correlated with RMSSD and HF power.
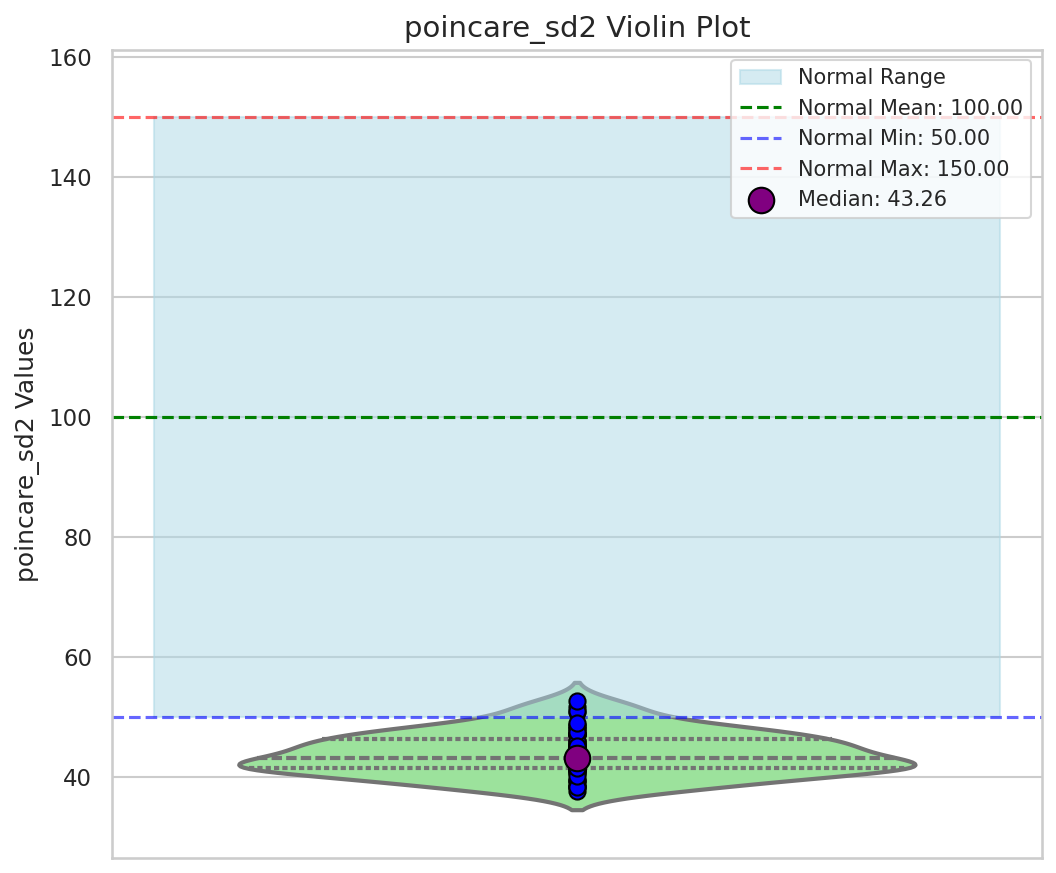
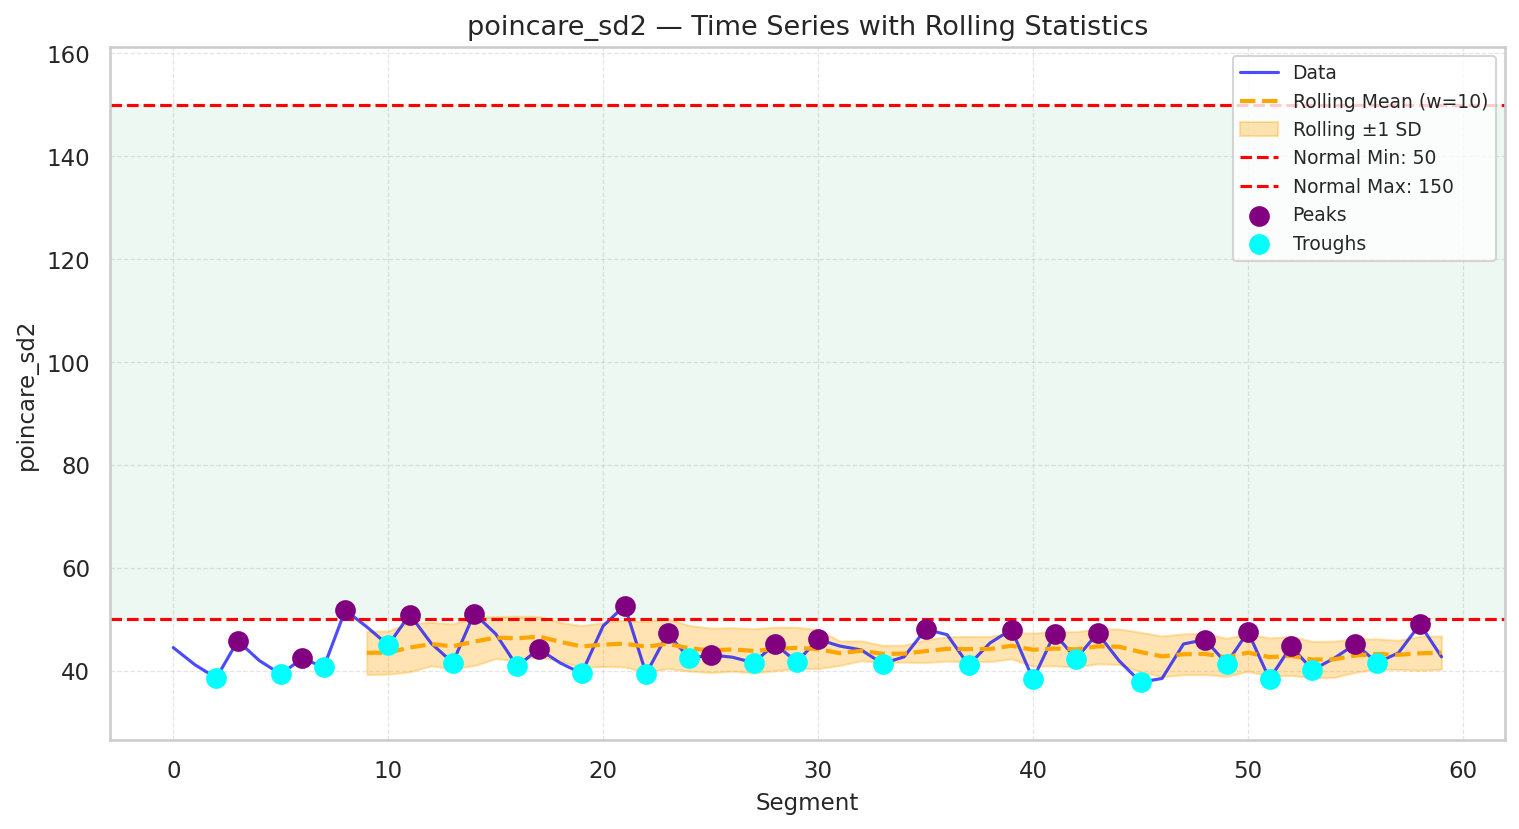
poincare_sd2
Description:
SD2 represents long-term variability in heart rate, associated with both sympathetic and parasympathetic activity. It reflects the length of the Poincaré plot and is indicative of overall heart rate variability. Your current value of 43.9 is below the normal range of 50-150.
Interpretation:
Low SD2 suggests reduced long-term variability, often seen in autonomic dysfunction or cardiovascular disease. Your poincare_sd2 value of 43.9 is below the normal range.
Values
Median
43.257
Standard Deviation
3.570
Range
50
150
Contradiction:
Low SD2 contradicts high SDNN, as both reflect long-term variability and autonomic balance.
Correlation Analysis:
Correlated with SDNN and long-term HRV.
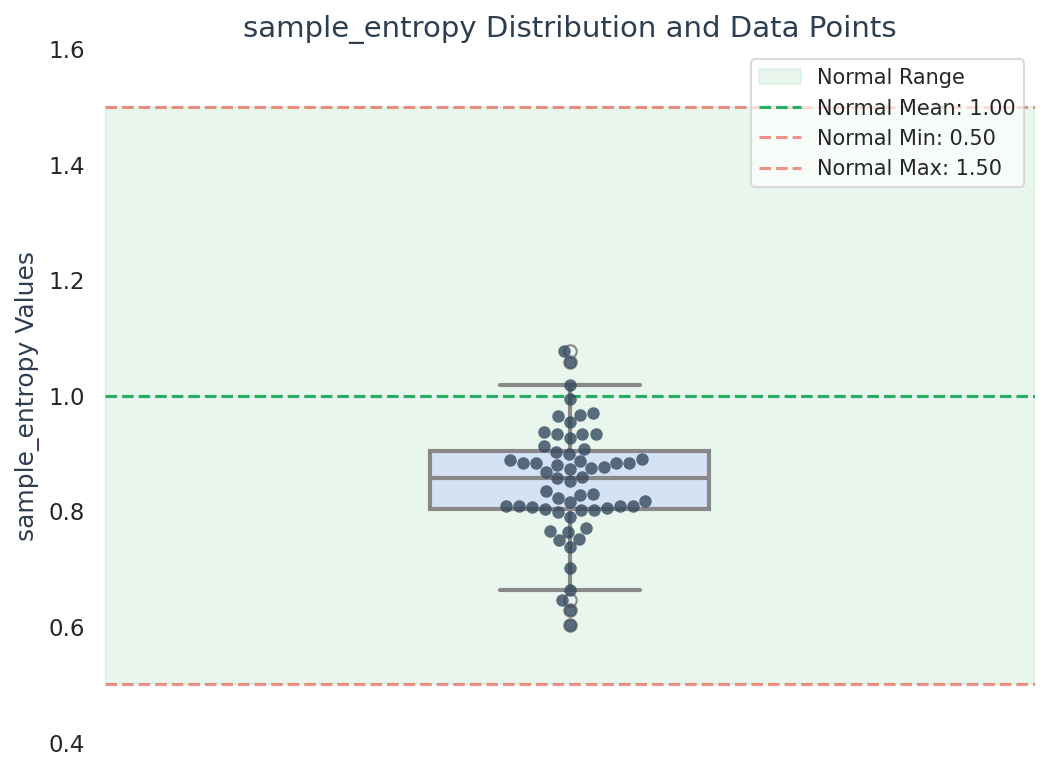
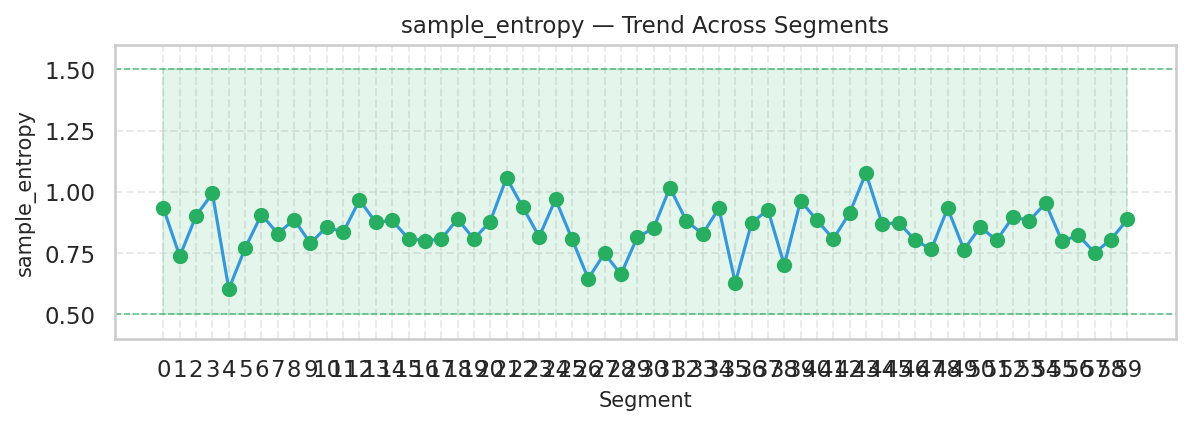
sample_entropy
Description:
Sample entropy measures the complexity and predictability of a physiological signal like the PPG. Lower entropy indicates a more predictable and regular signal, often seen in reduced variability, while higher entropy reflects greater irregularity and noise, which can be indicative of arrhythmias or signal abnormalities. Your current value of 0.8 is in the good range of 0.5-1.5, indicating healthy function.
Interpretation:
Normal sample entropy suggests a balance between signal regularity and variability, indicative of healthy cardiac function. Your sample_entropy value of 0.8 is normal the normal range.
Values
Median
0.858
Standard Deviation
0.095
Range
0.5
1.5
Contradiction:
Low sample entropy contradicts high fractal dimension, as both reflect signal complexity.
Correlation Analysis:
Correlated with DFA and other measures of complexity, such as approximate entropy.
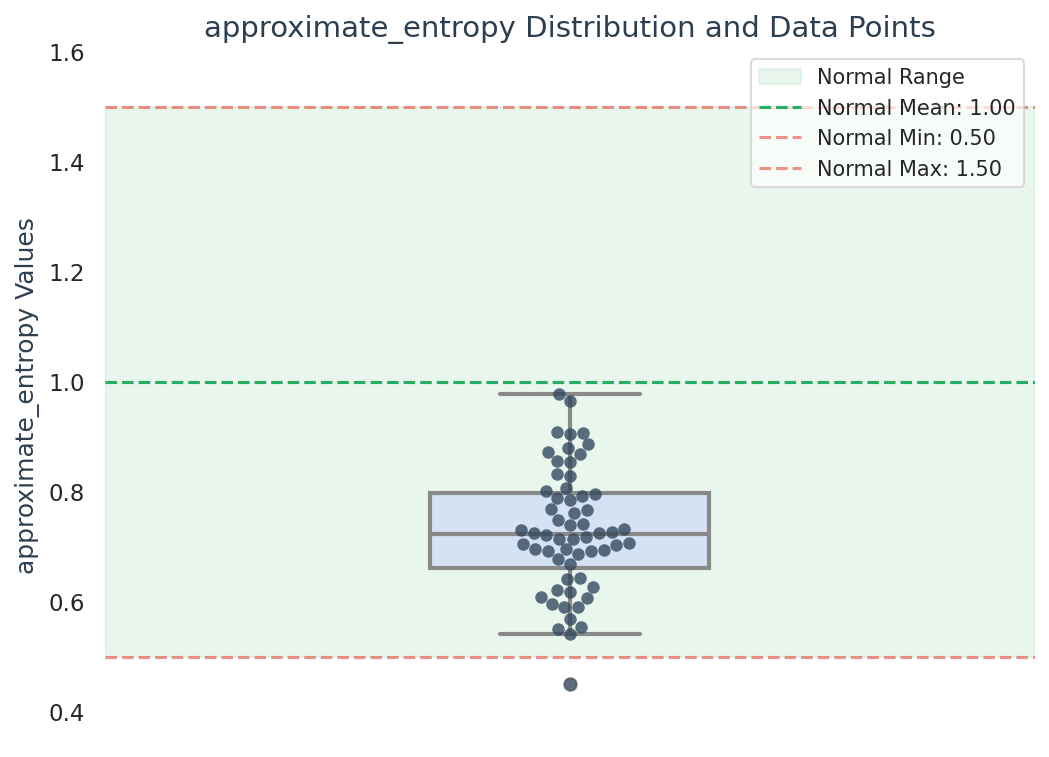
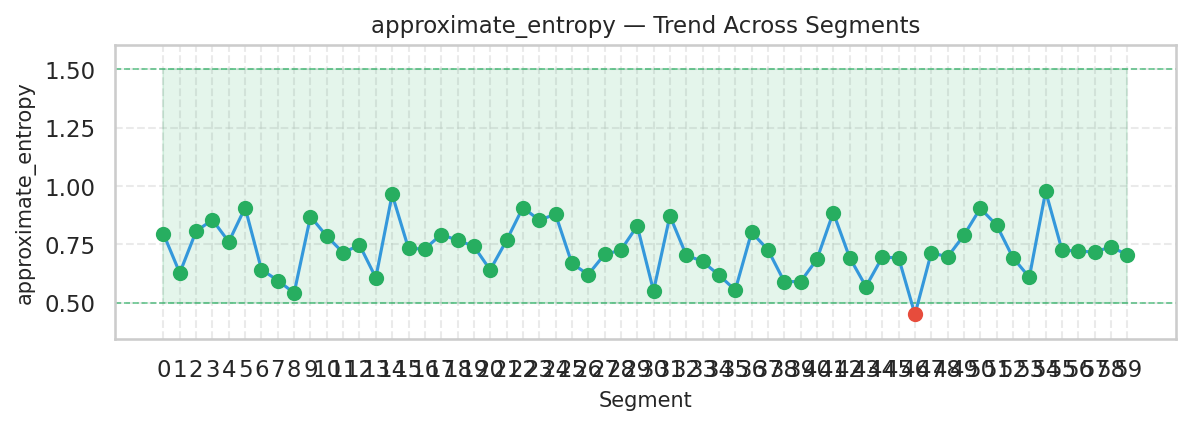
approximate_entropy
Description:
Approximate entropy measures the complexity and unpredictability of physiological signals such as the PPG. It reflects the likelihood of similar patterns recurring. High entropy indicates increased randomness, while low entropy suggests regularity, often seen in reduced HRV or autonomic dysfunction. Your current value of 0.7 is within the normal range of 0.5-1.5.
Interpretation:
Normal approximate entropy reflects healthy variability in physiological signals, with an appropriate balance between regularity and randomness. Your approximate_entropy value of 0.7 is normal the normal range.
Values
Median
0.723
Standard Deviation
0.111
Range
0.5
1.5
Contradiction:
High approximate entropy contradicts low sample entropy, as both should measure similar signal properties.
Correlation Analysis:
Correlated with sample entropy and other complexity measures.
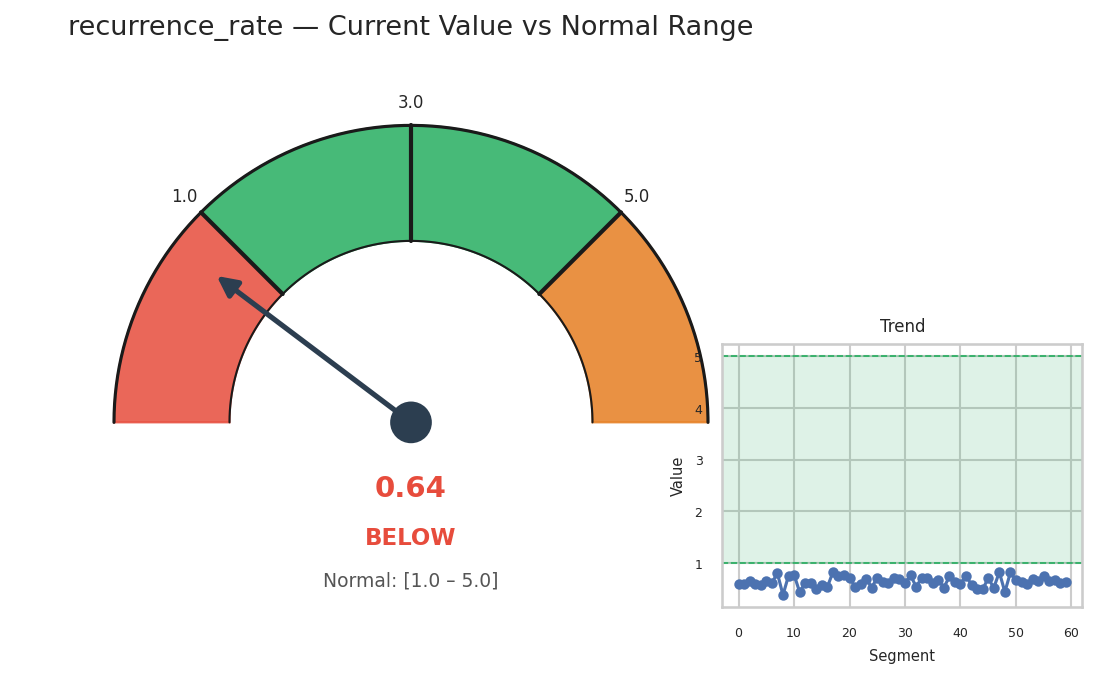
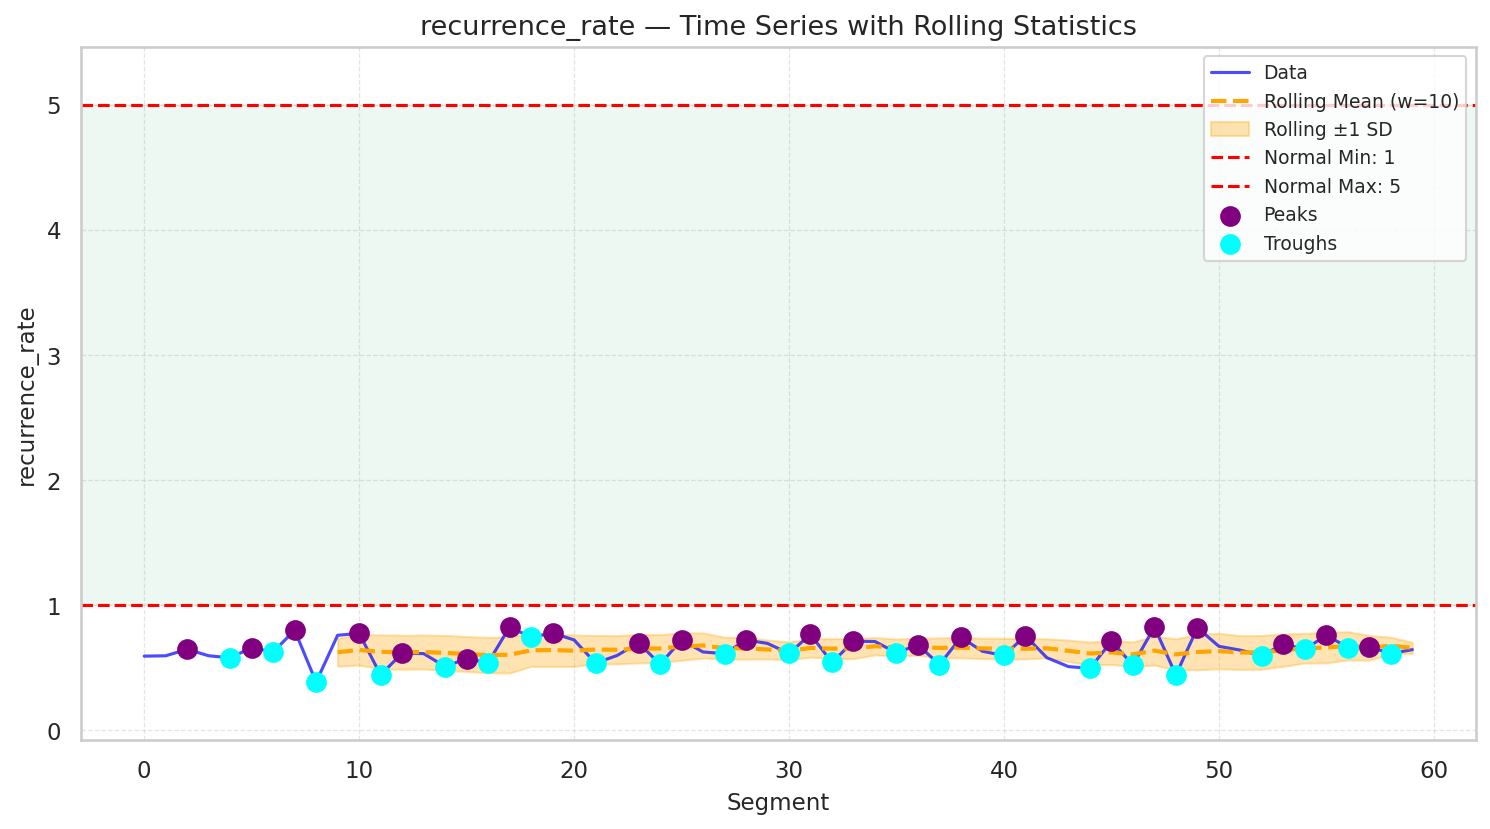
recurrence_rate
Description:
Recurrence rate measures how often the physiological signal returns to the same state over time, providing insight into the periodicity of the signal. A reduced recurrence rate may reflect autonomic dysfunction or irregular cardiac rhythms, while an elevated recurrence rate can indicate excessive signal regularity. Your current value of 0.6 is below the normal range of 1-5.
Interpretation:
Low recurrence rate points to irregular or chaotic signal behavior, potentially indicating arrhythmias, autonomic dysfunction, or cardiac instability. Your recurrence_rate value of 0.6 is below the normal range.
Values
Median
0.636
Standard Deviation
0.099
Range
1
5
Contradiction:
High recurrence rate contradicts high sample entropy, as increased regularity should reduce signal complexity.
Correlation Analysis:
Correlated with other measures of signal regularity and predictability.
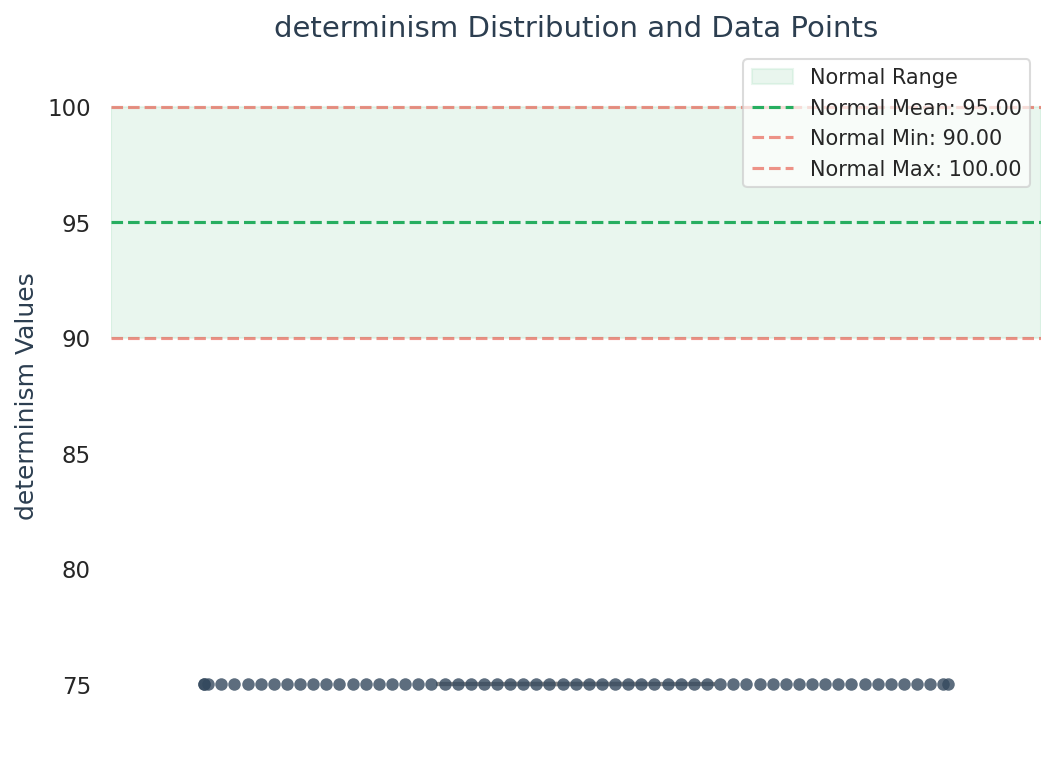
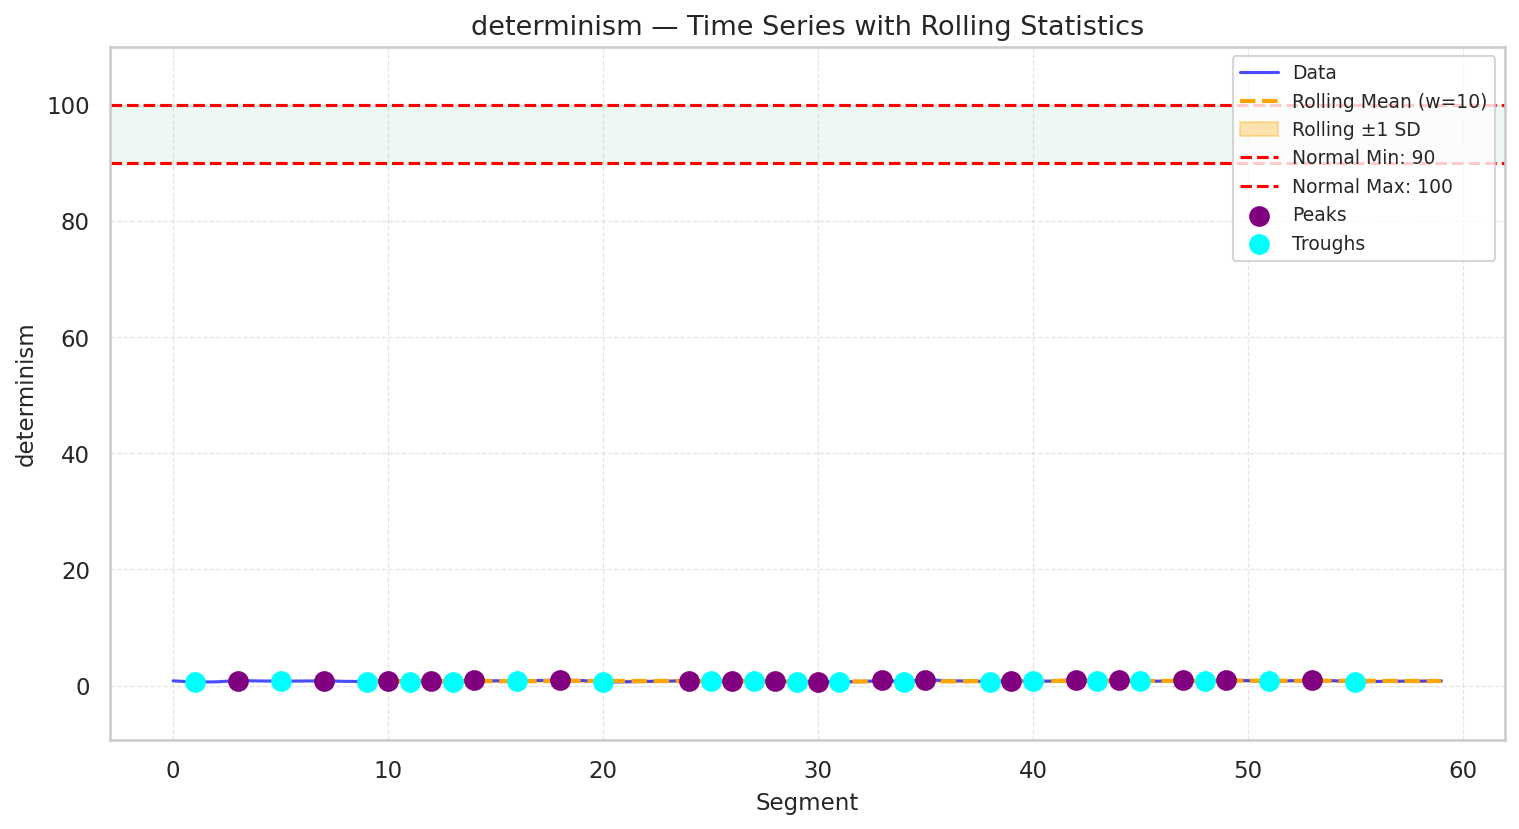
determinism
Description:
Determinism quantifies the predictability of a physiological signal based on past behavior. High determinism reflects a predictable signal, while low determinism suggests a more chaotic signal. This measure is critical in assessing the regularity and stability of heart rate or blood flow dynamics. Your current value of 0.8 is significantly below the normal range of 90-100, indicating potential health concerns.
Interpretation:
Low determinism suggests chaotic and unpredictable heart rate patterns, which may indicate arrhythmias, autonomic dysfunction, or cardiac instability. Your determinism value of 0.8 is below the normal range.
Values
Median
0.782
Standard Deviation
0.101
Range
90
100
Contradiction:
High determinism contradicts high approximate entropy, as high entropy reflects randomness while determinism reflects predictability.
Correlation Analysis:
Correlated with recurrence rate and signal regularity.
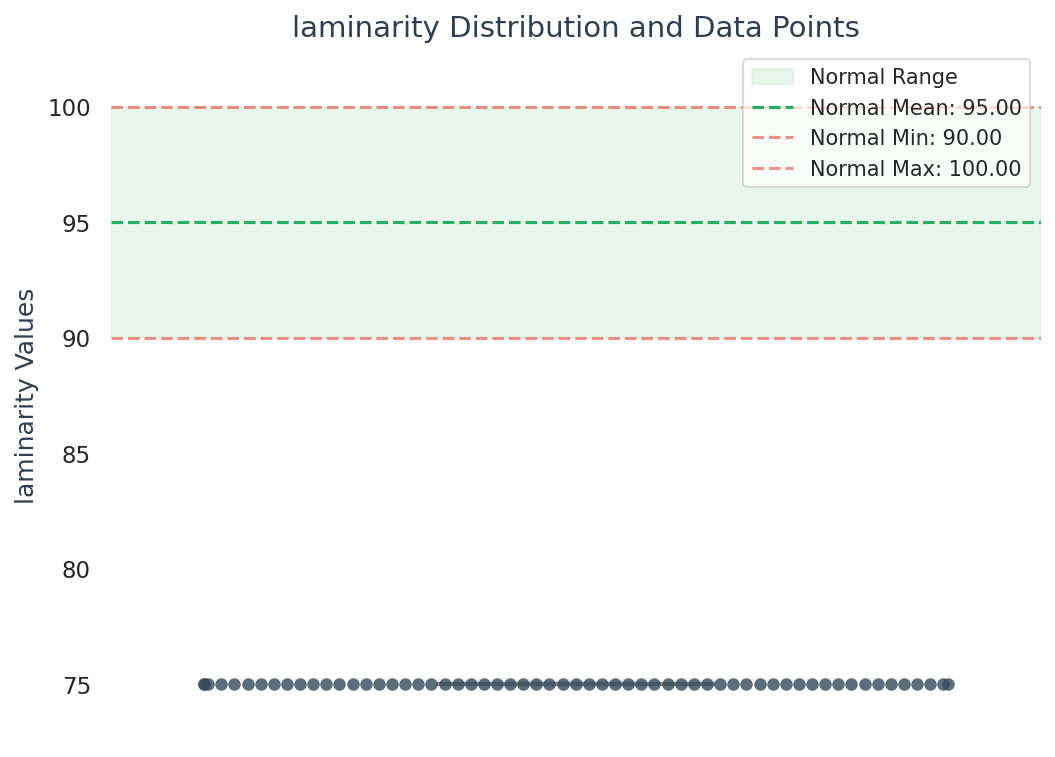
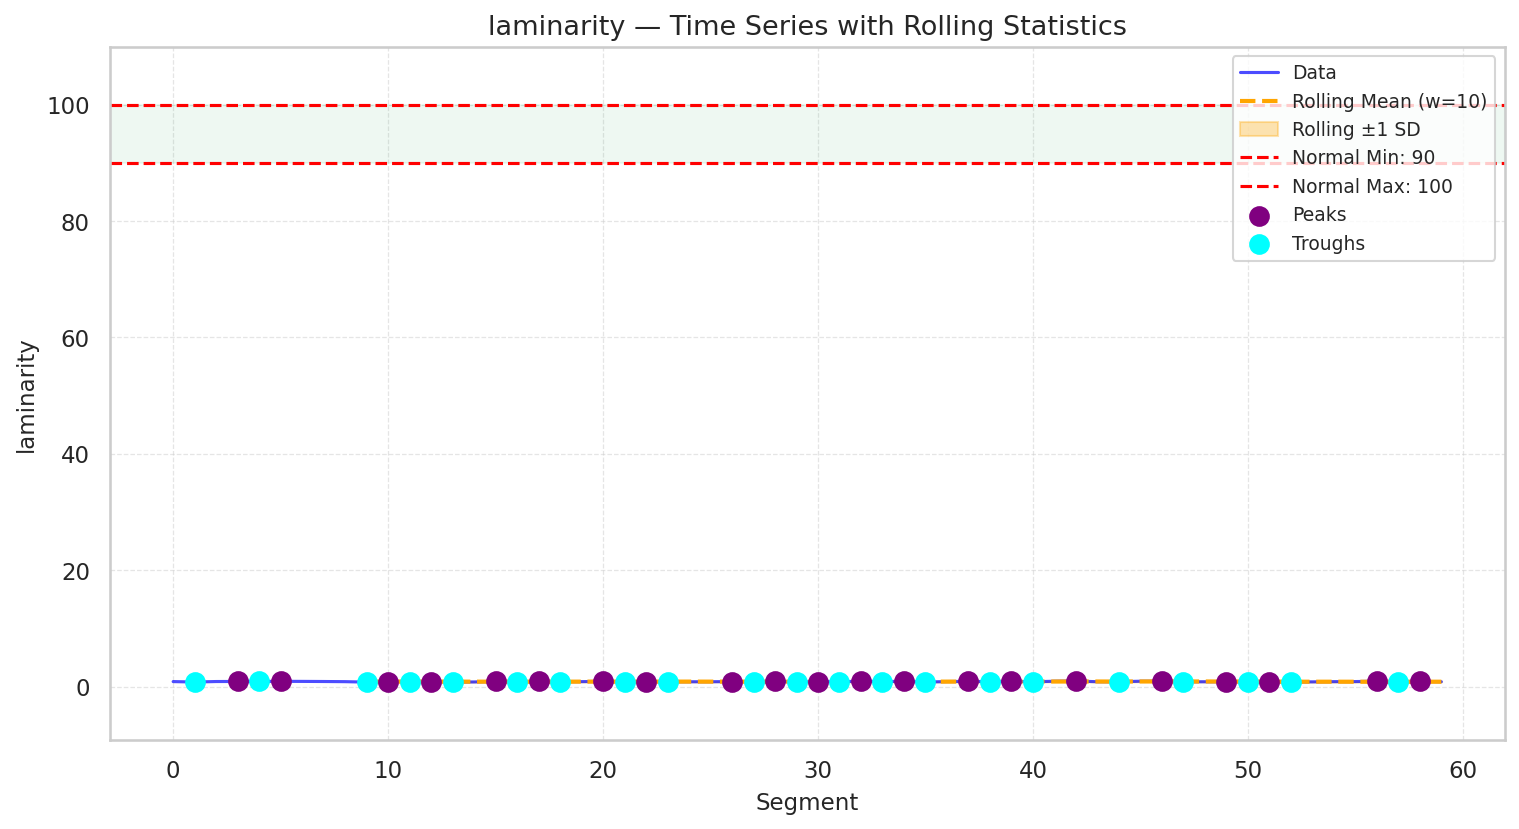
laminarity
Description:
Laminarity measures the smooth, repetitive patterns in the physiological signal, such as heart rate. A high degree of laminarity indicates consistent, smooth signal behavior, while reduced laminarity points to irregularity, which could suggest arrhythmias or autonomic dysfunction. Your current value of 0.9 is significantly below the normal range of 90-100, indicating potential health concerns.
Interpretation:
Low laminarity suggests irregular heart rhythms, often seen in arrhythmias, atrial fibrillation, or autonomic dysfunction. Your laminarity value of 0.9 is below the normal range.
Values
Median
0.853
Standard Deviation
0.043
Range
90
100
Contradiction:
High laminarity contradicts high DFA, as DFA measures fractal scaling, which should align with less regularity.
Correlation Analysis:
Correlated with determinism and signal predictability.
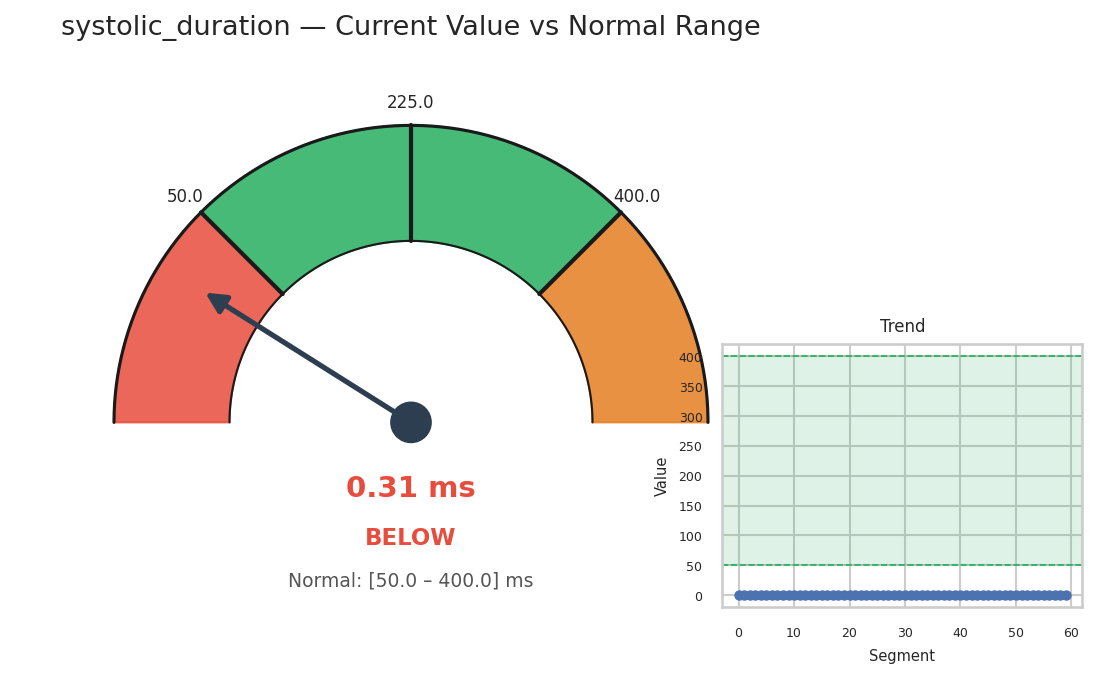
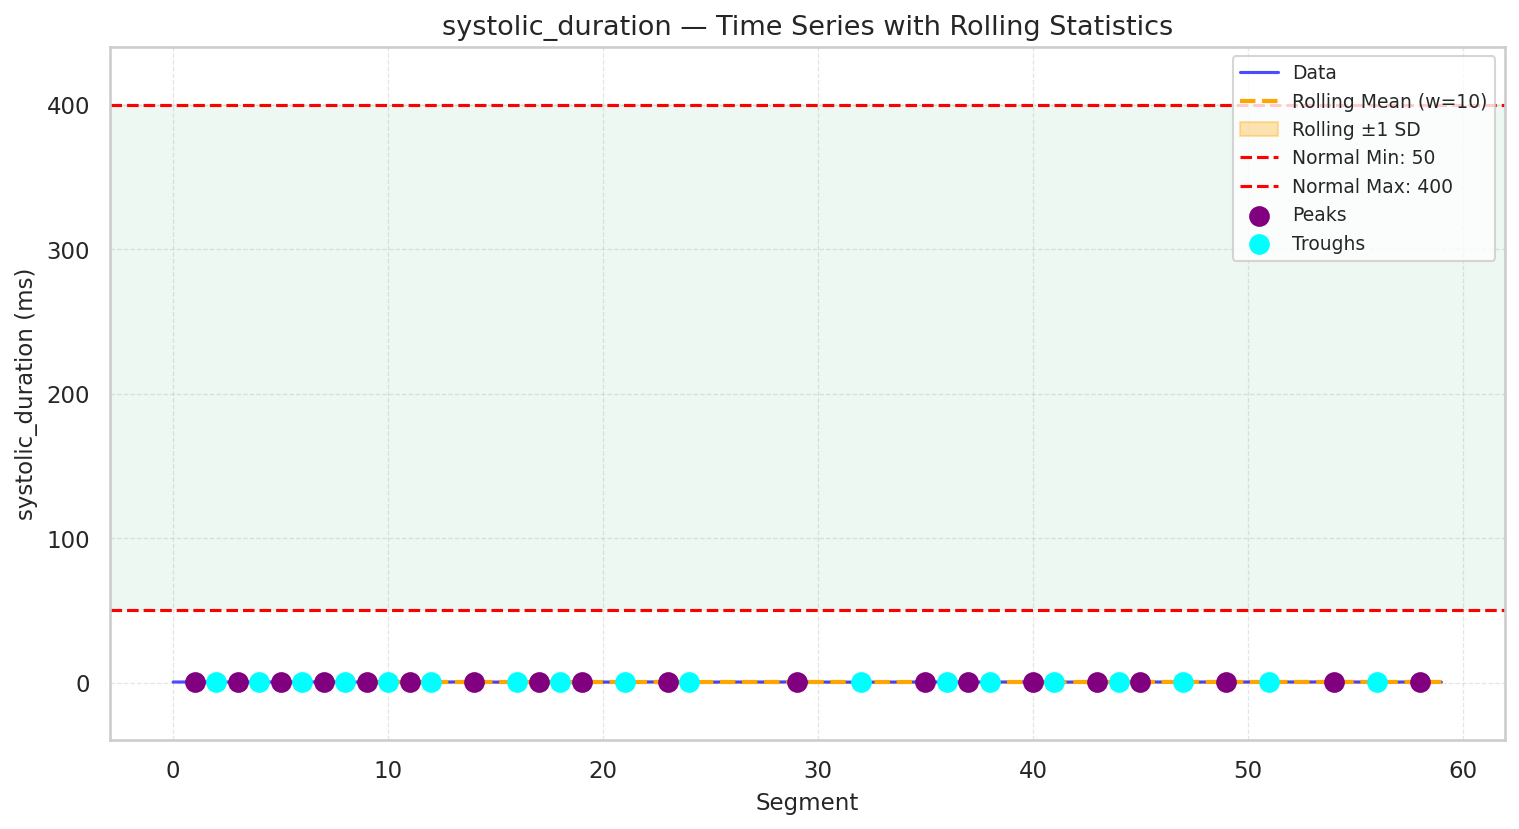
systolic_duration
Description:
Systolic duration represents the time the heart spends in contraction during the cardiac cycle. Short systolic durations may indicate high heart rates or reduced cardiac output, while prolonged durations could indicate cardiac overload or ventricular dysfunction. Your current value of 0.4 is below the normal range of 50-400.
Interpretation:
Short systolic duration may indicate increased heart rate, reduced stroke volume, or conditions such as tachycardia, requiring evaluation of cardiac output. Your systolic_duration value of 0.4 is below the normal range.
Values
Median
0.364
Standard Deviation
0.047
Range
50
400
Contradiction:
A prolonged systolic duration with short diastolic duration contradicts normal heart function.
Correlation Analysis:
Should be correlated with diastolic duration to maintain healthy systolic/diastolic balance.
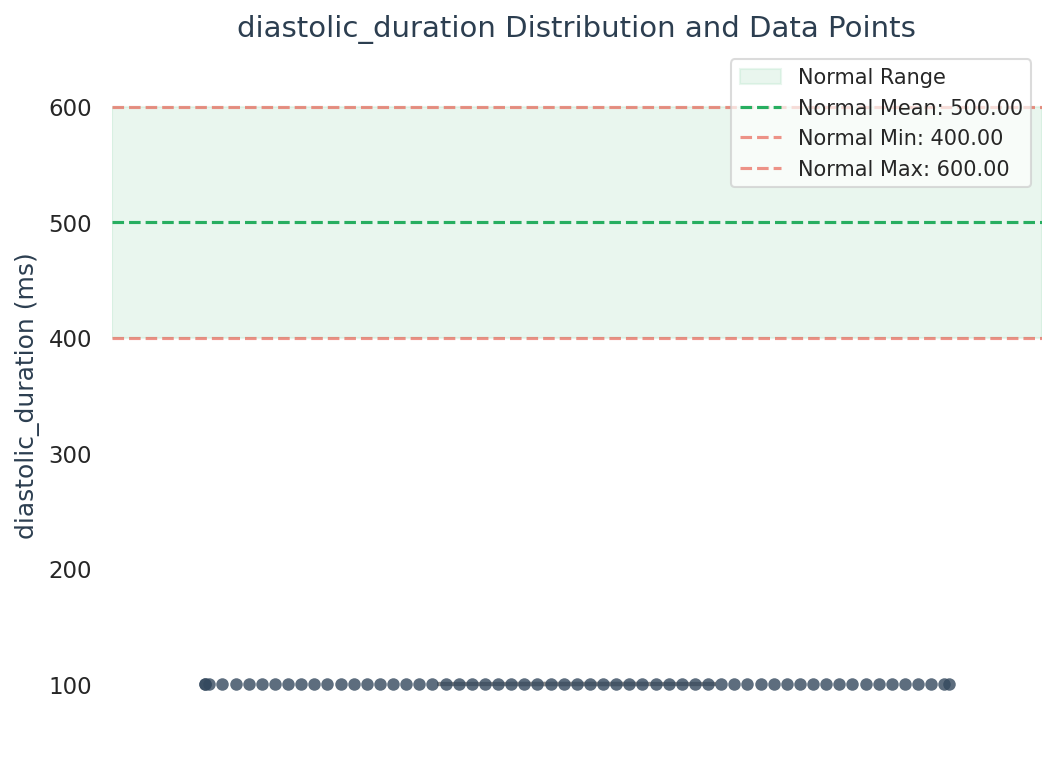
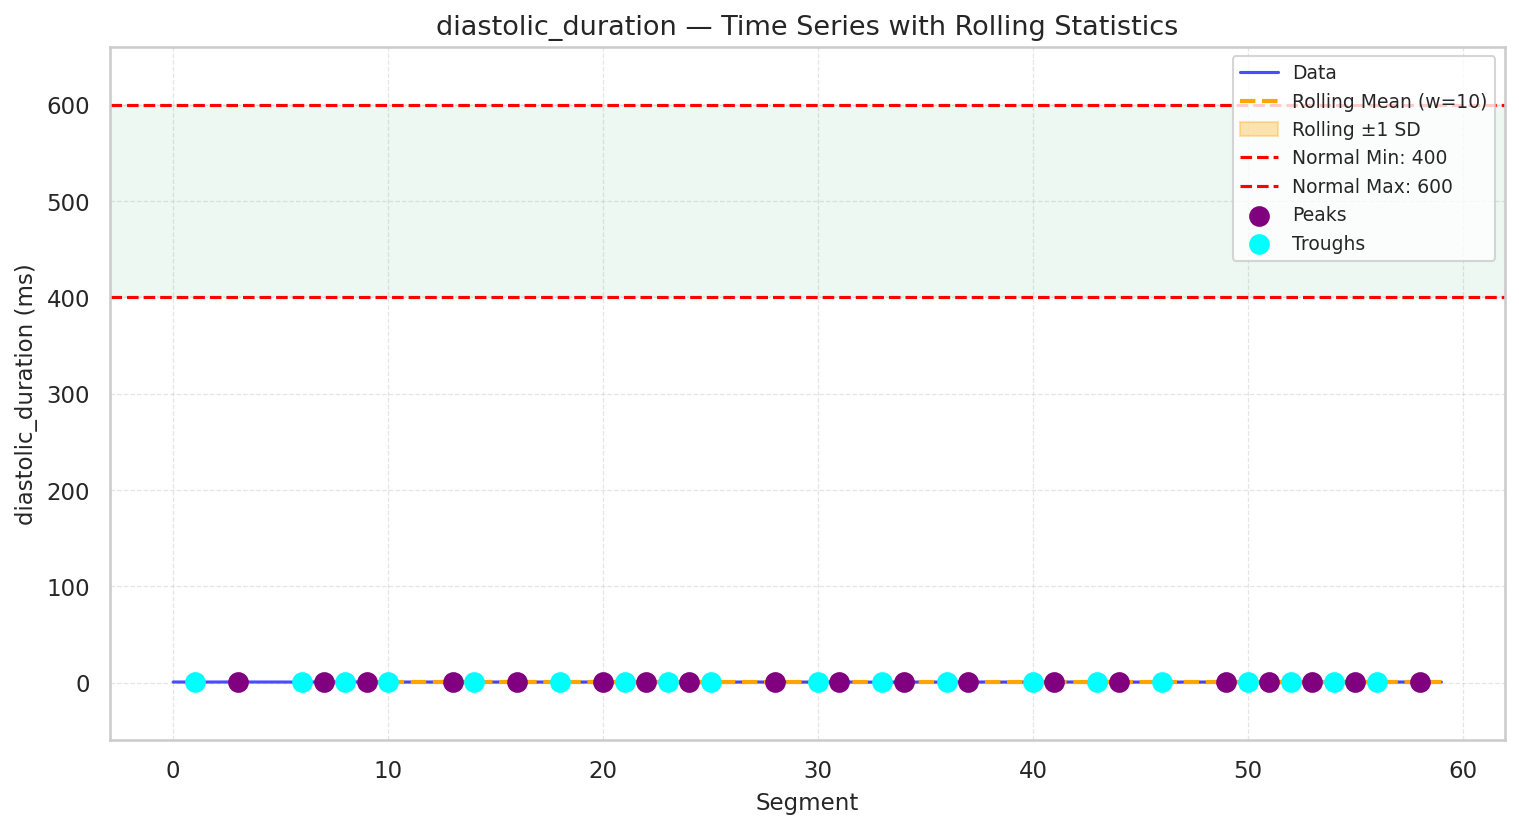
diastolic_duration
Description:
Diastolic duration reflects the time the heart spends in relaxation, allowing ventricular filling. This phase is crucial for the heart to receive blood before the next contraction. Shortened diastolic duration is often seen in conditions with elevated heart rates, poor relaxation, or cardiovascular stress, while prolonged diastolic duration may indicate bradycardia or impaired ventricular contraction. Your current value of 0.5 is significantly below the normal range of 400-600, indicating potential health concerns.
Interpretation:
Short diastolic duration may indicate reduced ventricular filling, commonly due to tachycardia or stress-related conditions that increase heart rate, such as sepsis or heart failure. Your diastolic_duration value of 0.5 is below the normal range.
Values
Median
0.510
Standard Deviation
0.046
Range
400
600
Contradiction:
A prolonged diastolic duration with short systolic duration contradicts healthy cardiac output.
Correlation Analysis:
Should be correlated with systolic duration to maintain a balanced cardiac cycle.
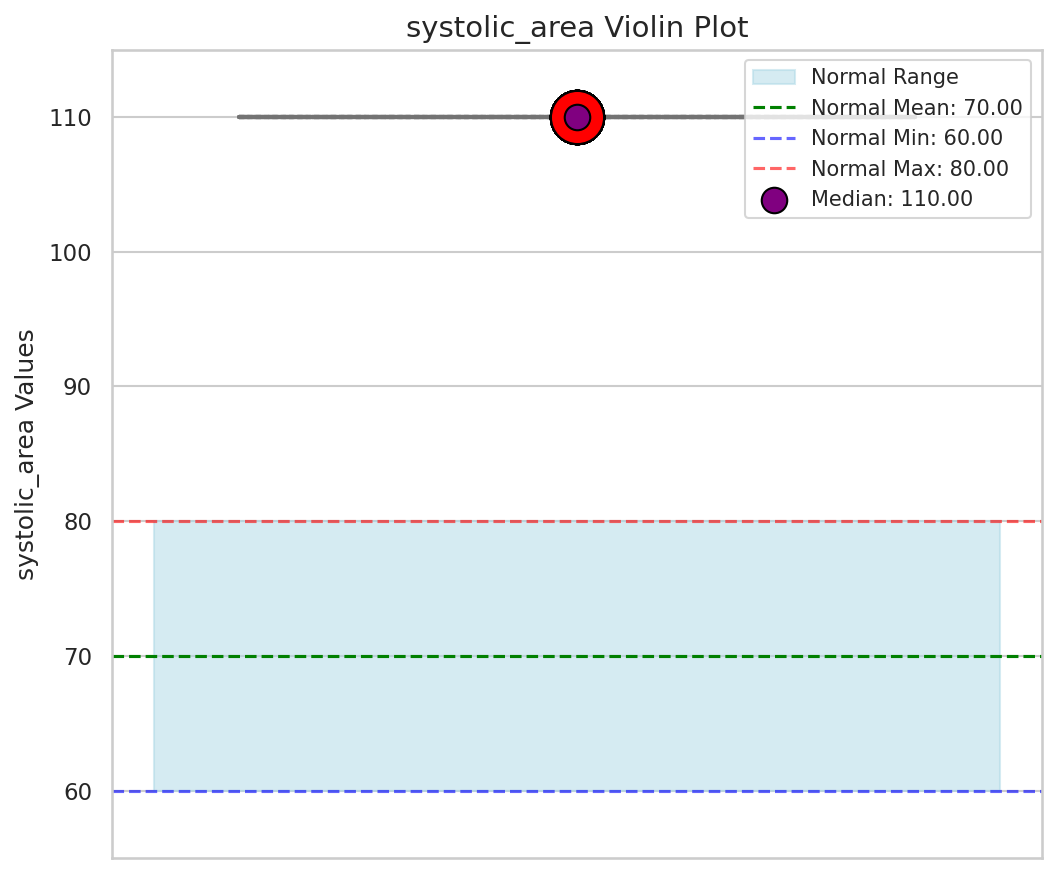
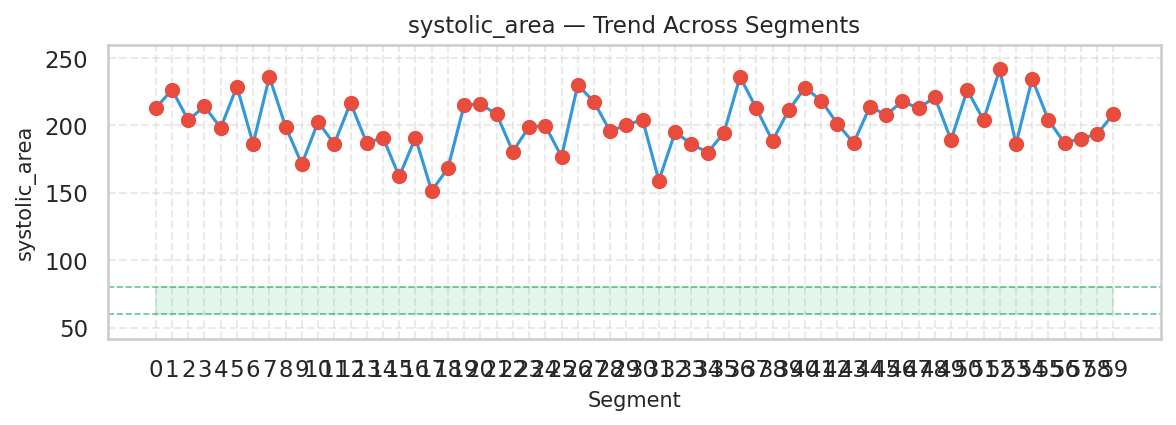
systolic_area
Description:
The systolic area under the curve represents the amount of blood ejected during the systolic phase, reflecting cardiac output. A larger systolic area suggests increased cardiac workload, while a reduced systolic area indicates impaired ejection fraction or ventricular dysfunction. Your current value of 201.9 is significantly above the normal range of 60-80, which may require attention.
Interpretation:
Increased systolic area indicates elevated cardiac output, which may be caused by hypertension, increased ventricular contractility, or stress-related conditions. Your systolic_area value of 201.9 is above the normal range.
Values
Median
201.877
Standard Deviation
19.637
Range
60
80
Contradiction:
A disproportionately large systolic area contradicts low diastolic area and may indicate poor cardiac relaxation.
Correlation Analysis:
Correlated with systolic duration and overall cardiac output.
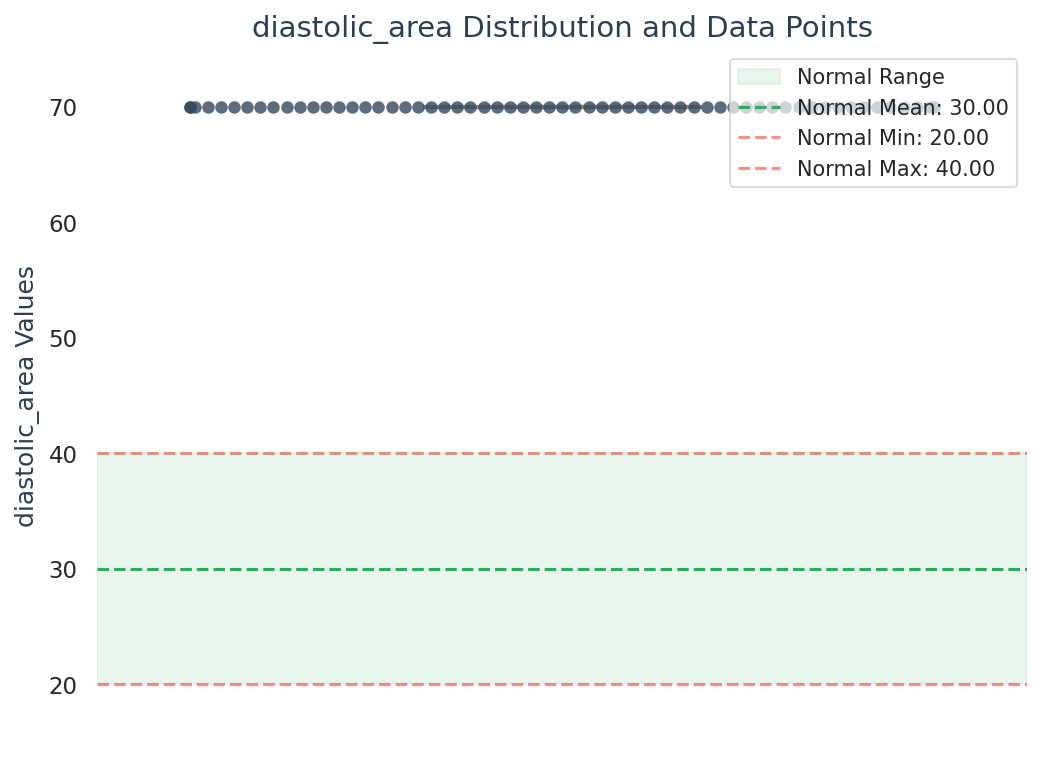
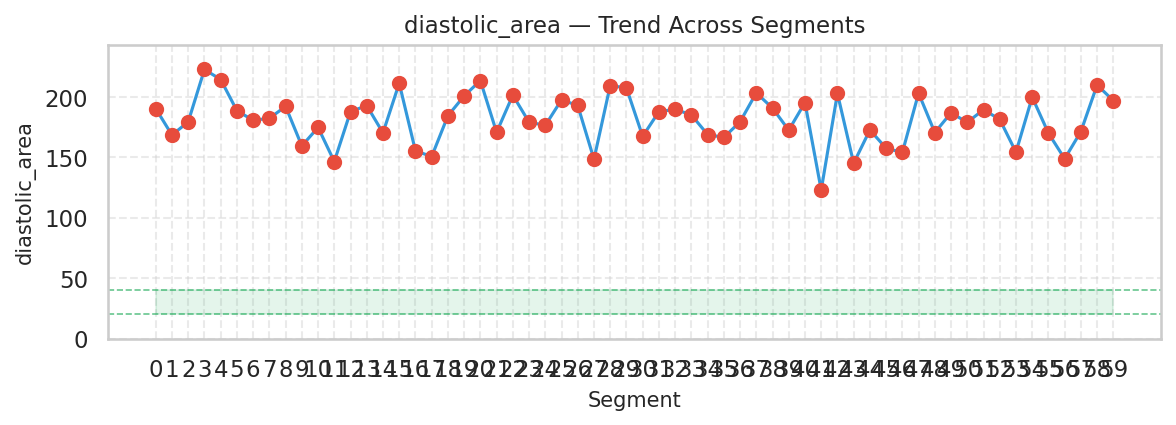
diastolic_area
Description:
The diastolic area under the curve reflects ventricular filling during the relaxation phase. An abnormal diastolic area can indicate poor ventricular compliance or excessive preload. A balance between systolic and diastolic areas is essential for optimal cardiac function. Your current value of 181.3 is significantly above the normal range of 20-40, which may require attention.
Interpretation:
Increased diastolic area suggests enhanced ventricular filling, which may be compensatory due to increased preload or reduced ventricular contractility. Your diastolic_area value of 181.3 is above the normal range.
Values
Median
181.969
Standard Deviation
20.399
Range
20
40
Contradiction:
A disproportionately large diastolic area contradicts low systolic area and may suggest reduced cardiac output.
Correlation Analysis:
Correlated with diastolic duration and overall cardiac relaxation.
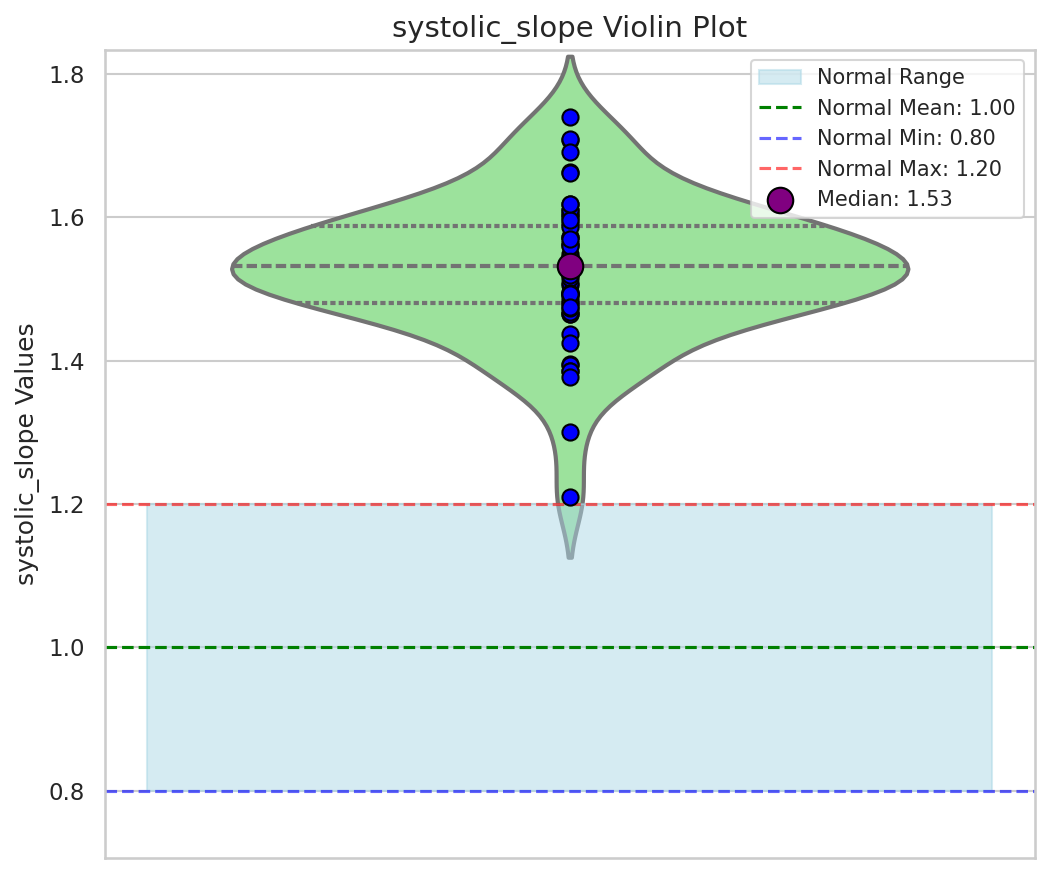
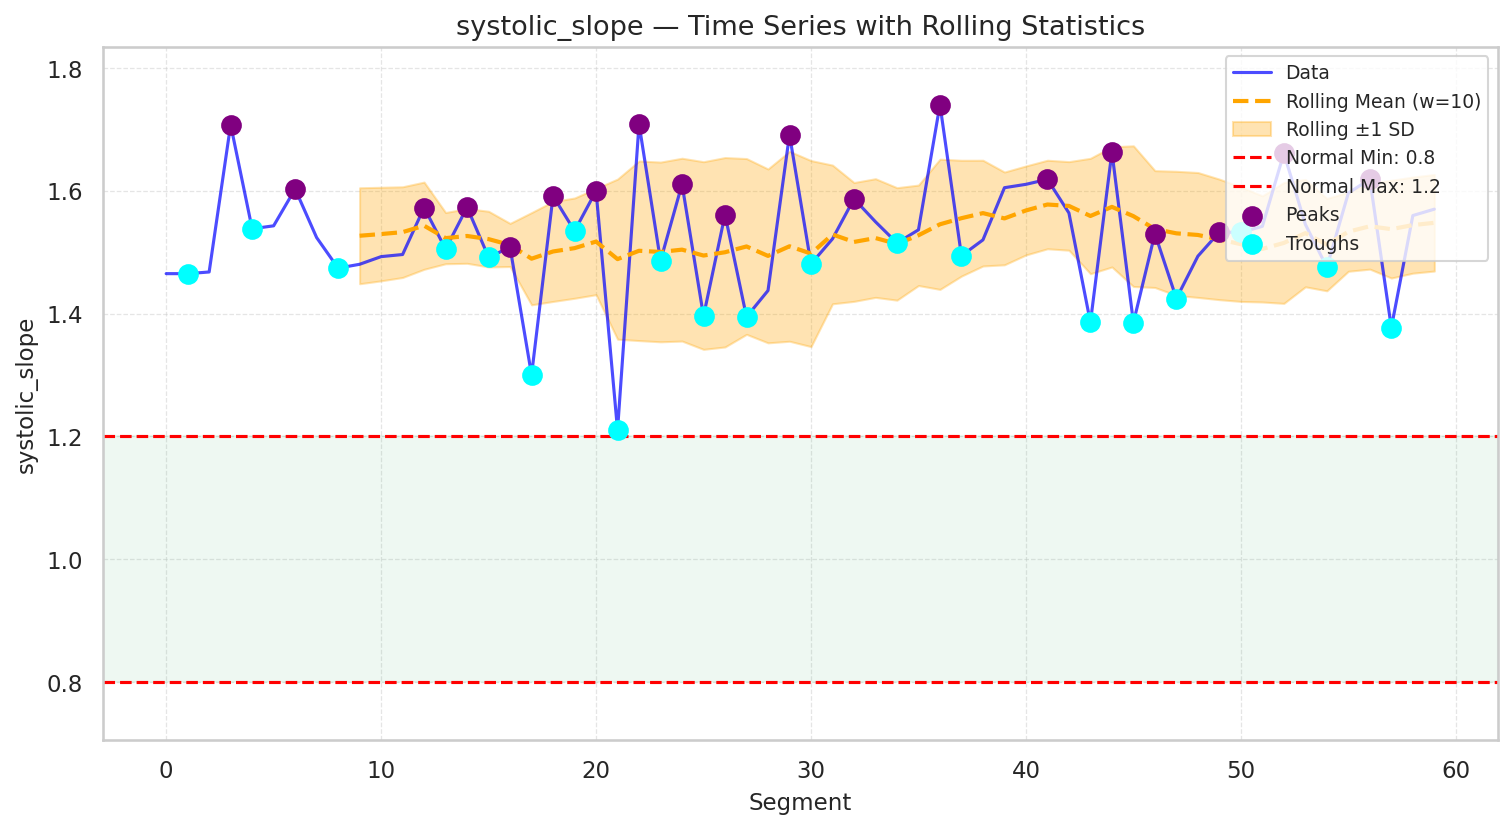
systolic_slope
Description:
Reflects the steepness of the systolic rise in the waveform. Your current value of 1.5 is above the normal range of 0.8-1.2.
Interpretation:
High systolic slope suggests increased ventricular contraction, often due to stress or elevated cardiac output. Your systolic_slope value of 1.5 is above the normal range.
Values
Median
1.533
Standard Deviation
0.095
Range
0.8
1.2
Contradiction:
A disproportionately high systolic slope contradicts low diastolic slope, indicating imbalanced cardiac function.
Correlation Analysis:
Correlated with systolic duration and cardiac output.
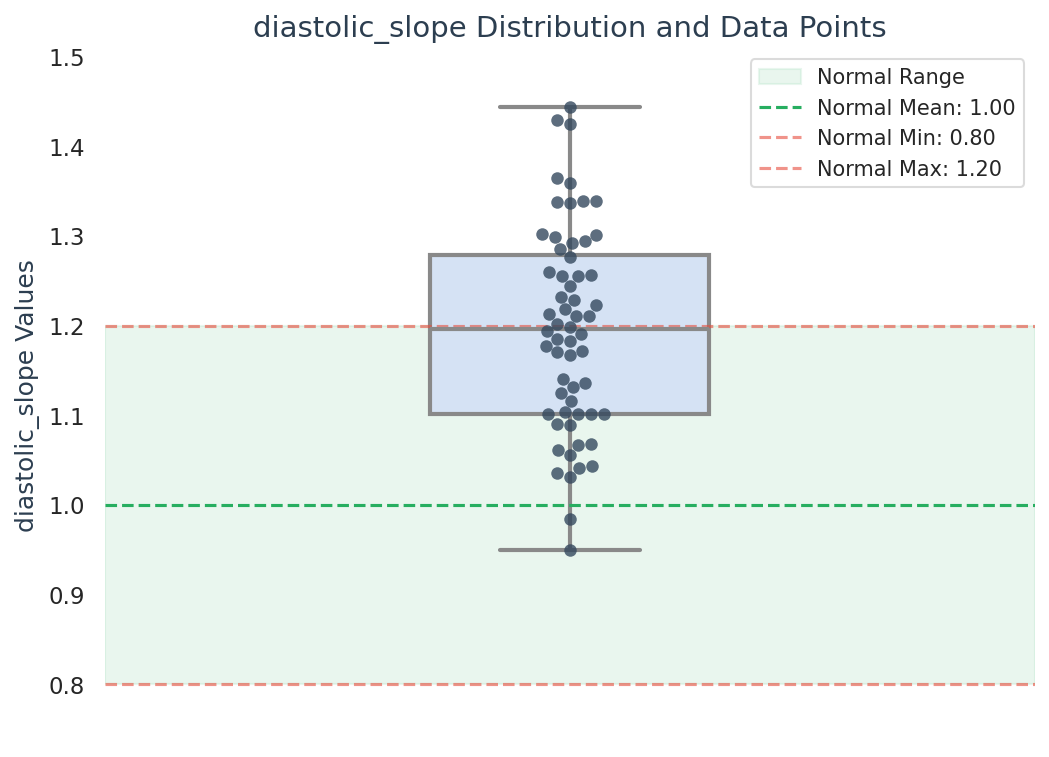
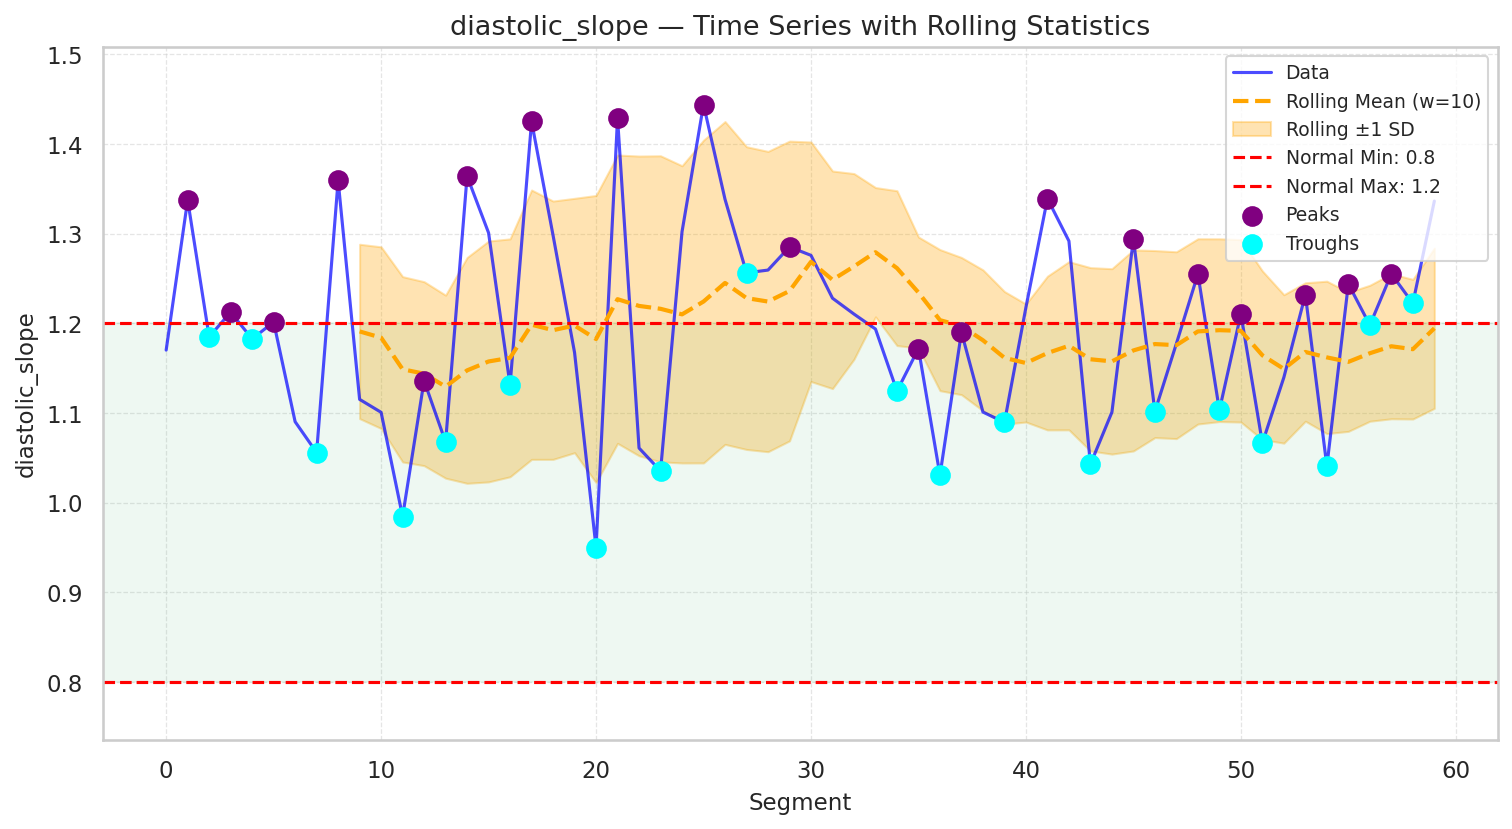
diastolic_slope
Description:
Reflects the steepness of the diastolic decay in the waveform. Your current value of 1.2 is within the normal range of 0.8-1.2.
Interpretation:
Normal diastolic slope, indicating healthy cardiac relaxation. Your diastolic_slope value of 1.2 is normal the normal range.
Values
Median
1.196
Standard Deviation
0.113
Range
0.8
1.2
Contradiction:
A high diastolic slope with low systolic slope contradicts normal cardiac function.
Correlation Analysis:
Correlated with diastolic duration and cardiac relaxation.
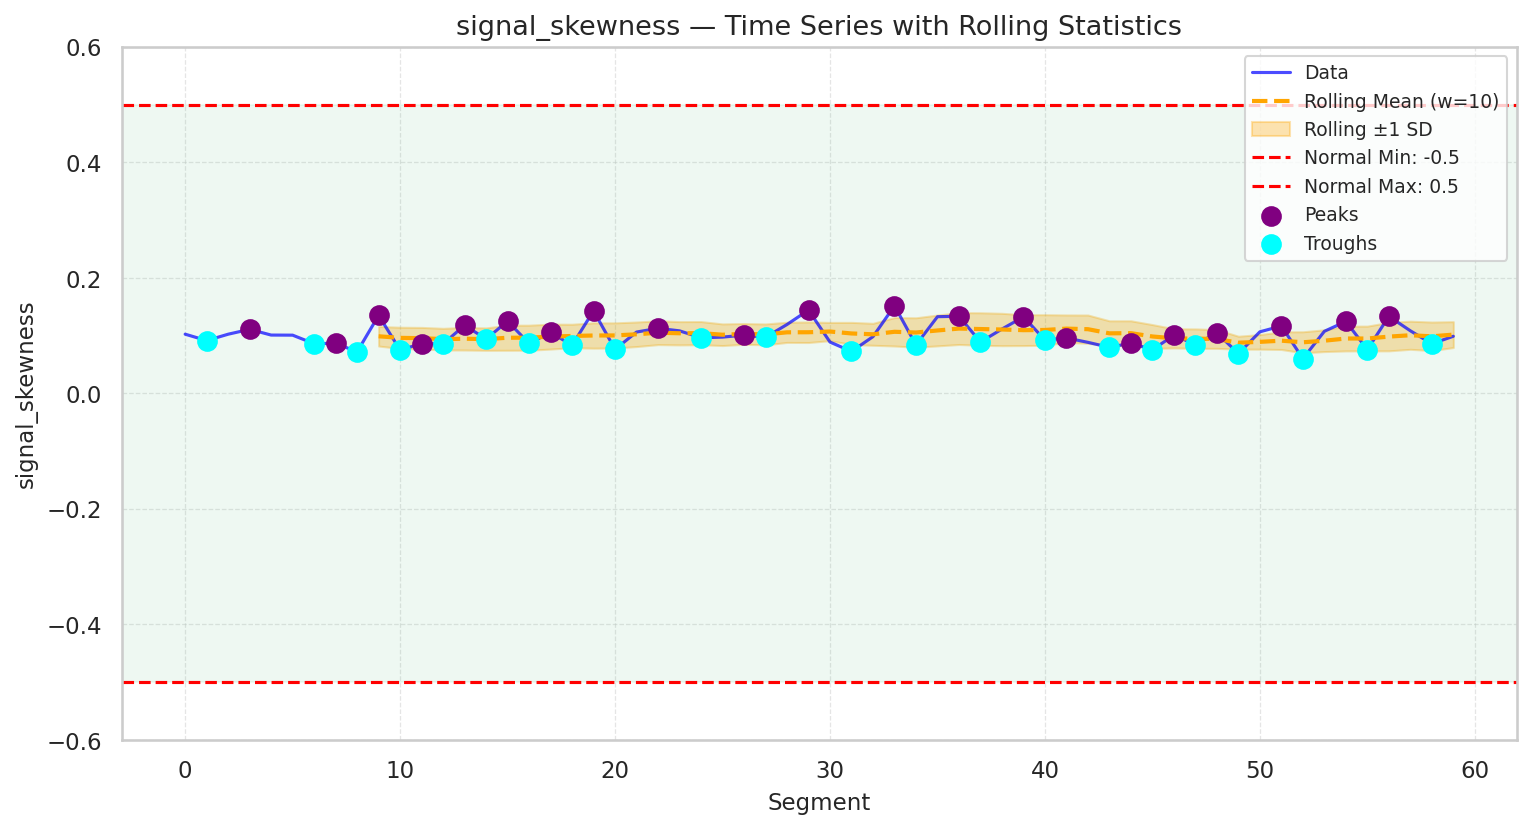
signal_skewness
Description:
Signal skewness measures the asymmetry of the PPG waveform. A skewed waveform may indicate abnormalities in vascular compliance, arrhythmias, or signal noise. Negative skewness reflects prolonged diastolic filling, while positive skewness indicates faster systolic ejection. Your current value of 0.1 is in the good range of -0.5-0.5, indicating healthy function.
Interpretation:
Normal skewness reflects a well-balanced systolic and diastolic waveform, indicating proper cardiac and vascular function. Your signal_skewness value of 0.1 is normal the normal range.
Values
Median
0.099
Standard Deviation
0.020
Range
-0.5
0.5
Contradiction:
High signal skewness contradicts low systolic amplitude variability, as high skewness usually reflects variability in the signal.
Correlation Analysis:
Correlated with systolic and diastolic variability, reflecting overall signal irregularity.

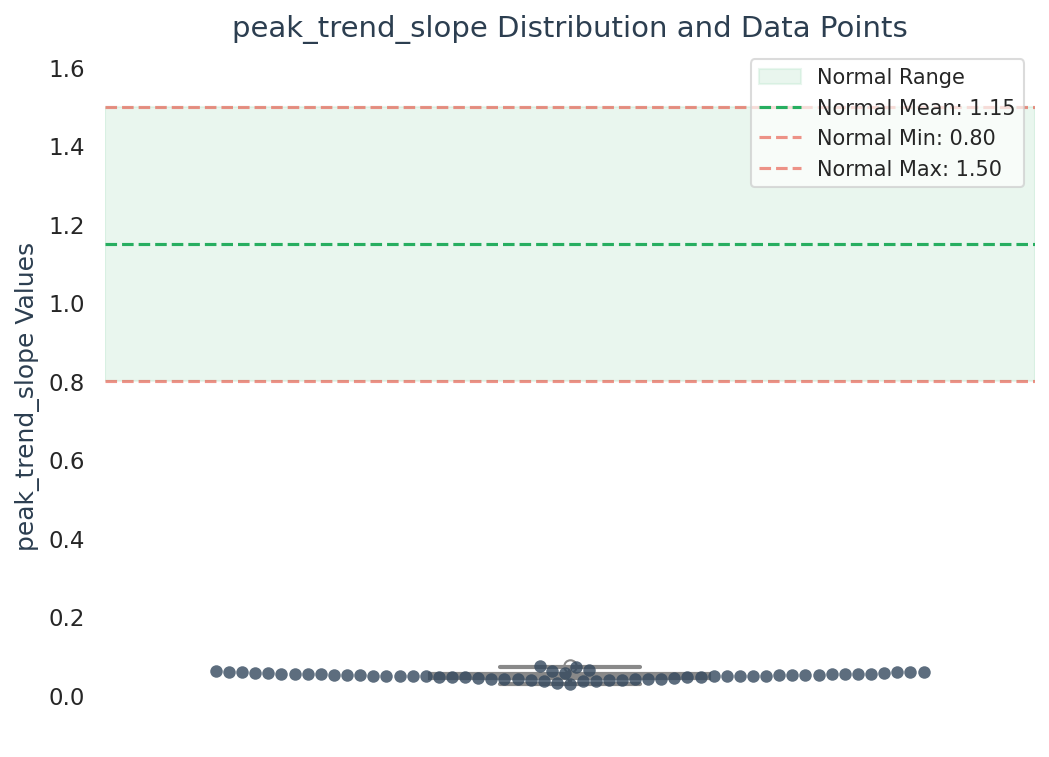
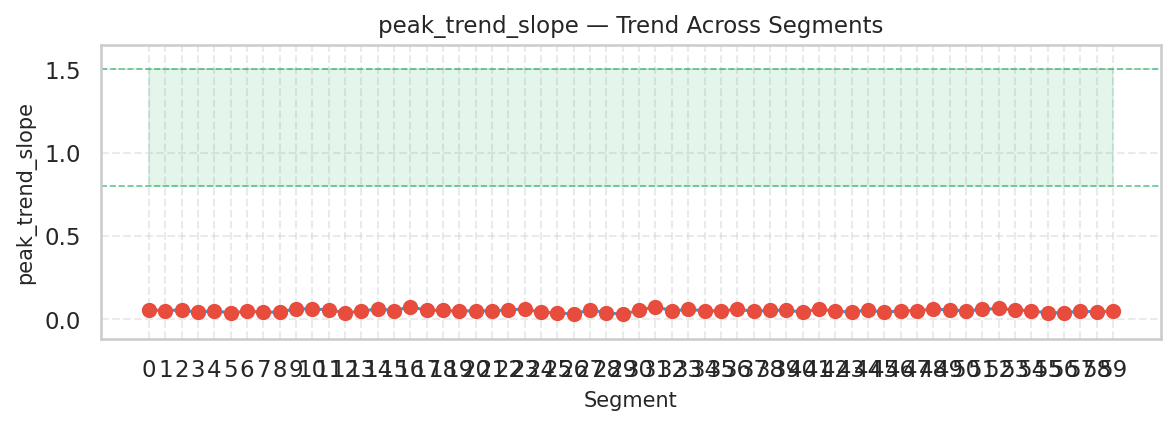
peak_trend_slope
Description:
Peak trend slope represents the rate of change between successive peaks in the pulse waveform, reflecting changes in cardiac output or vascular resistance. An increasing slope suggests heightened cardiac workload, while a decreasing slope indicates reduced output or poor compliance. Your current value of 0.1 is significantly below the normal range of 0.8-1.5, indicating potential health concerns.
Interpretation:
A decreasing peak trend slope suggests reduced cardiac output or poor vascular compliance, often seen in heart failure, low cardiac output states, or vascular stiffness. Your peak_trend_slope value of 0.1 is below the normal range.
Values
Median
0.051
Standard Deviation
0.009
Range
0.8
1.5
Contradiction:
A low peak trend slope contradicts high systolic slope, indicating an imbalance in cardiac function.
Correlation Analysis:
Correlated with systolic slope and overall cardiac output.
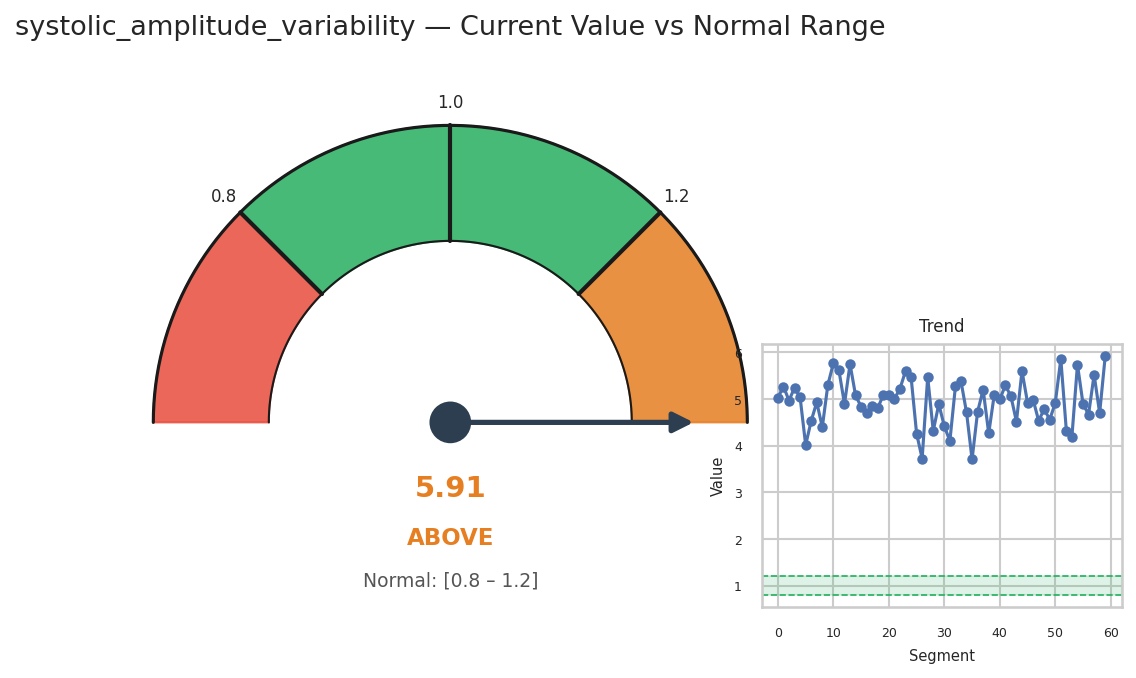
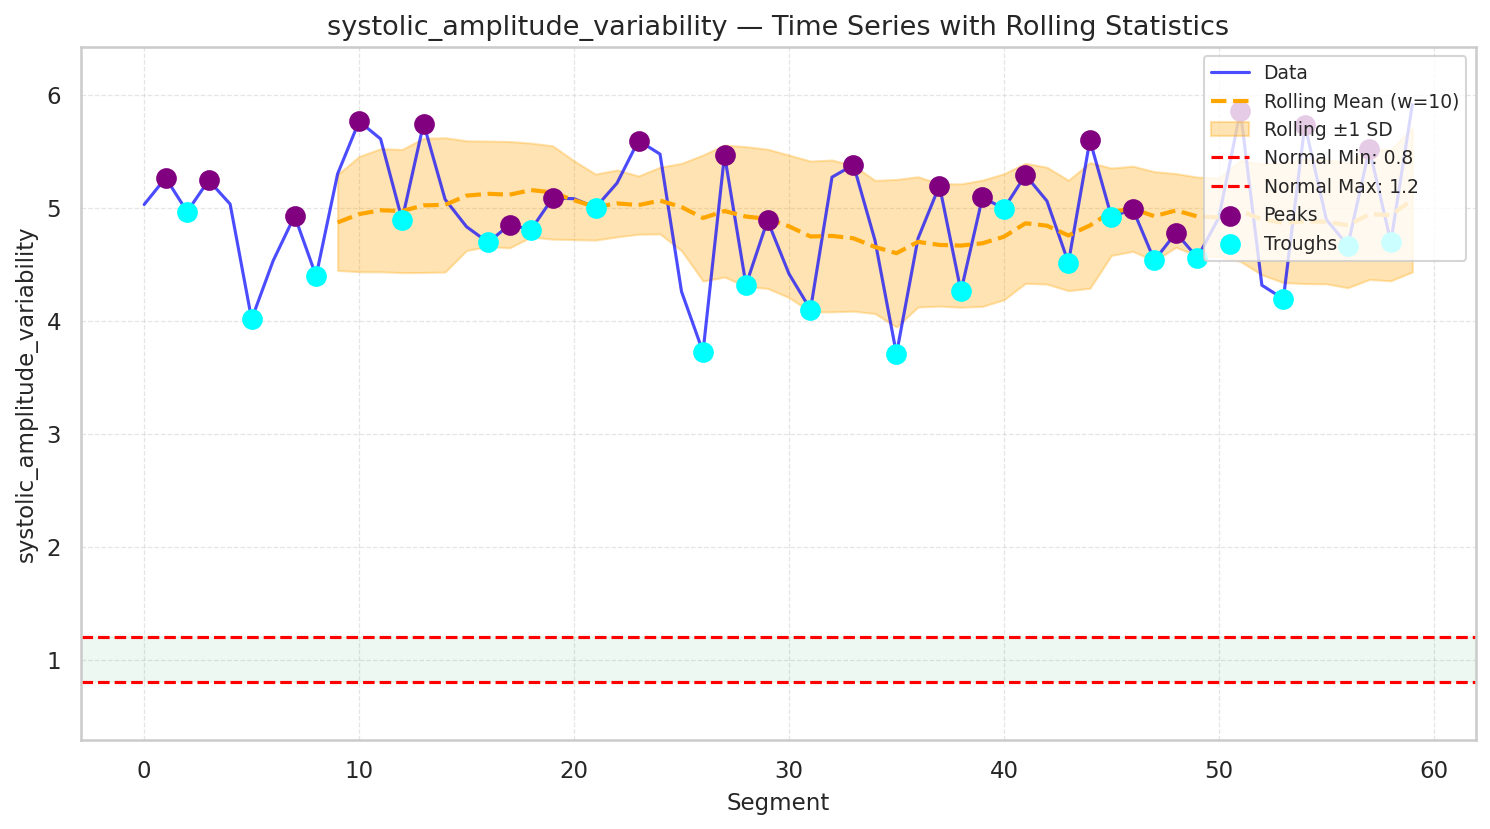
systolic_amplitude_variability
Description:
Reflects the variability in systolic peak amplitudes in the pulse waveform, which indicates fluctuations in cardiac output and ventricular contraction strength. Your current value of 4.9 is significantly above the normal range of 0.8-1.2, which may require attention.
Interpretation:
High systolic amplitude variability may suggest fluctuating cardiac output, often seen in stress, arrhythmias, or fluctuating blood pressure. Your systolic_amplitude_variability value of 4.9 is above the normal range.
Values
Median
4.946
Standard Deviation
0.507
Range
0.8
1.2
Contradiction:
High systolic amplitude variability with low diastolic amplitude variability indicates imbalanced cardiac function.
Correlation Analysis:
Correlated with systolic duration and overall cardiac output variability.
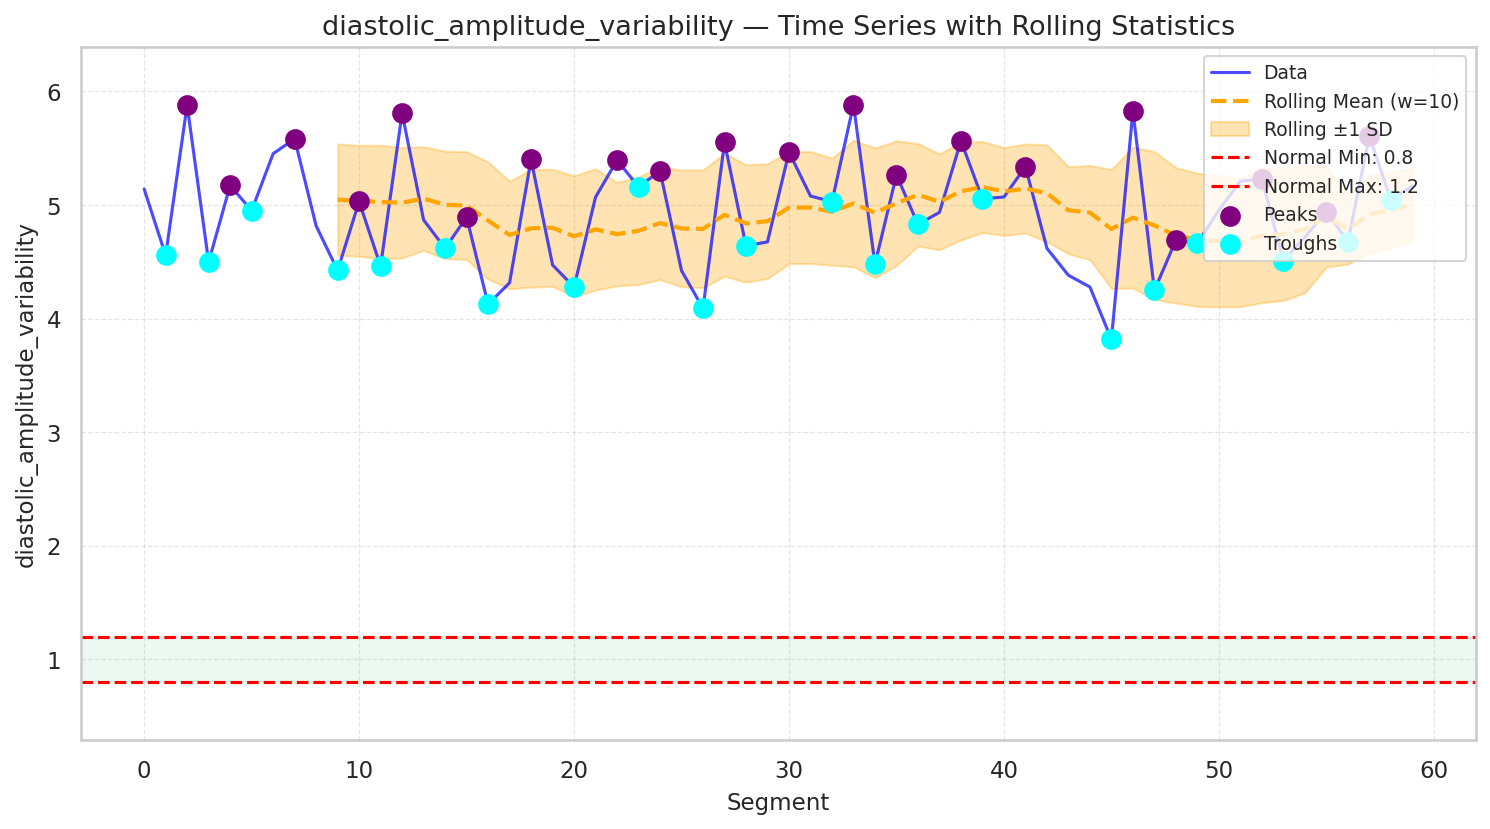
diastolic_amplitude_variability
Description:
Represents the variability in diastolic peak amplitudes in the pulse waveform, reflecting changes in cardiac relaxation and filling during the diastolic phase. Your current value of 4.9 is significantly above the normal range of 0.8-1.2, which may require attention.
Interpretation:
High diastolic amplitude variability could indicate unstable cardiac relaxation patterns, possibly due to arrhythmias or compensatory mechanisms. Your diastolic_amplitude_variability value of 4.9 is above the normal range.
Values
Median
4.945
Standard Deviation
0.480
Range
0.8
1.2
Contradiction:
High diastolic amplitude variability with low systolic amplitude variability indicates imbalanced cardiac function.
Correlation Analysis:
Correlated with diastolic duration and cardiac relaxation variability.
Save the health report as HTML file
# Write the HTML content to a file
with open("../_static/report.html", "w") as file:
    file.write(report_html)
Display the HTML file in the notebook
# Display the HTML file in the notebook
display_html('<iframe src="../_static/report.html" width=700 height=350></iframe>', raw=True)